« Back to Mount Pleasant Rivers
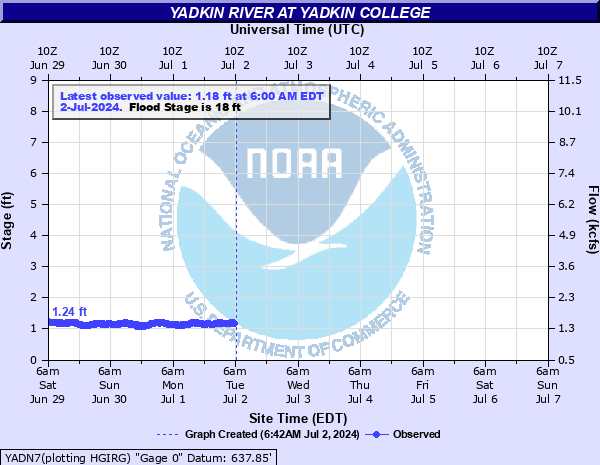
Yadkin River at Yadkin College
Critical Stages
17' - Action
18' - Flood
25' - Moderate
29' - Major
Latest Observation
Updated: 9:00 PM EST 12/8/25
Status: No Flooding
Stage: 1.2 ft
Flow: 1.52 kcfs
Forecast
Forecast not available for this location.
| Time | Stage (ft) | Flow (kcfs) |
|---|---|---|
| 9:00 PM 12/8 | 1.2 | 1.52 |
| 8:45 PM 12/8 | 1.21 | 1.53 |
| 8:30 PM 12/8 | 1.2 | 1.52 |
| 8:15 PM 12/8 | 1.21 | 1.53 |
| 8:00 PM 12/8 | 1.19 | 1.51 |
| 7:45 PM 12/8 | 1.2 | 1.52 |
| 7:30 PM 12/8 | 1.2 | 1.52 |
| 7:15 PM 12/8 | 1.2 | 1.52 |
| 7:00 PM 12/8 | 1.2 | 1.52 |
| 6:45 PM 12/8 | 1.21 | 1.53 |
| 6:30 PM 12/8 | 1.22 | 1.54 |
| 6:15 PM 12/8 | 1.22 | 1.54 |
| 6:00 PM 12/8 | 1.21 | 1.53 |
| 5:45 PM 12/8 | 1.22 | 1.54 |
| 5:30 PM 12/8 | 1.24 | 1.56 |
| 5:15 PM 12/8 | 1.21 | 1.53 |
| 5:00 PM 12/8 | 1.23 | 1.55 |
| 4:45 PM 12/8 | 1.23 | 1.55 |
| 4:30 PM 12/8 | 1.23 | 1.55 |
| 4:15 PM 12/8 | 1.25 | 1.57 |
| 4:00 PM 12/8 | 1.24 | 1.56 |
| 3:45 PM 12/8 | 1.25 | 1.57 |
| 3:30 PM 12/8 | 1.24 | 1.56 |
| 3:15 PM 12/8 | 1.24 | 1.56 |
| 3:00 PM 12/8 | 1.23 | 1.55 |
| 2:45 PM 12/8 | 1.23 | 1.55 |
| 2:30 PM 12/8 | 1.24 | 1.56 |
| 2:15 PM 12/8 | 1.24 | 1.56 |
| 2:00 PM 12/8 | 1.24 | 1.56 |
| 1:45 PM 12/8 | 1.23 | 1.55 |
33' -
There is extensive flooding of pasture and farm lands in Davie and Davidson county.
29' -
Major flooding begins. Several homes are flooded, with floodwaters covering an extensive area of primarily farm and pasture lands.
26' -
Several homes along the river begin to flood.
25' -
Moderate flooding begins. Flooding may close Sowers Road near Linwood and Hollywood Drive at Grub Ferry Rd. A campground on Hannah Ferry Road is flooded. Flooding threatens the pumping station at Davidson.
23' -
The upper campsites at the Thousand Trails Preserve off US-64 begin to flood.
21' -
Lower level campsites at the Thousand Trails Preserve off US-64 begin to flood.
18' -
Minor flooding begins. There is flooding of mainly farmlands on both banks.
15' -
The river is at bankfull.
| Date | Stage (ft) |
|---|---|
| Jul 1, 1916 | 36.3 |
| Aug 15, 1940 | 33.75 |
| Jun 22, 1972 | 32.81 |
| Oct 3, 1929 | 29.8 |
| Mar 2, 1987 | 29.55 |
| Aug 12, 1970 | 28.95 |
| Oct 21, 1937 | 27.5 |
| Oct 13, 2018 | 27.12 |
| Mar 15, 1975 | 26.51 |
| Mar 14, 1963 | 26.45 |
| Apr 23, 1992 | 26.28 |
| Mar 21, 2003 | 26.19 |
| Sep 19, 1945 | 26.17 |
| Oct 18, 1932 | 25.96 |
| Jan 26, 2010 | 25.84 |
| Jun 16, 1947 | 25.8 |
| Aug 18, 1928 | 25.5 |
| Jan 20, 1936 | 24.92 |
| Mar 25, 1993 | 24.02 |
| Mar 29, 1994 | 23.8 |
Data provided by the National Weather Service.