« Back to Mount Sterling Rivers
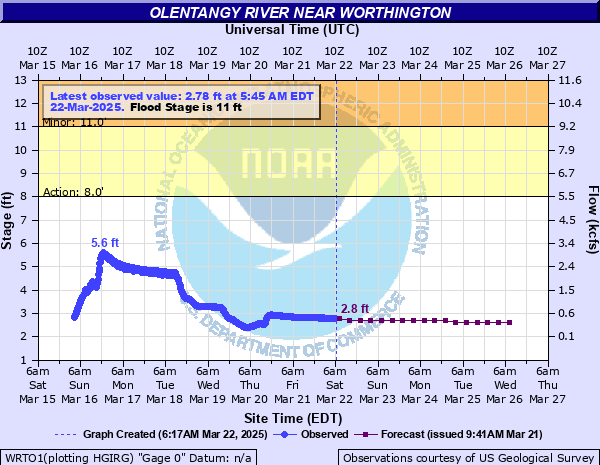
Olentangy River near Worthington
Critical Stages
8' - Action
11' - Flood
13' - Moderate
15' - Major
Latest Observation
Updated: 11:45 PM EST 12/4/25
Status: No Flooding
Stage: 1.51 ft
Flow: 0.025 kcfs
Forecast
| Time | Stage (ft) | Flow (kcfs) |
|---|---|---|
| 1 AM 12/5 | 1.5 | 0.024 |
| 7 AM 12/5 | 1.5 | 0.024 |
| 1 PM 12/5 | 1.5 | 0.024 |
| 7 PM 12/5 | 1.5 | 0.024 |
| 1 AM 12/6 | 1.5 | 0.024 |
| 7 AM 12/6 | 1.5 | 0.024 |
| 1 PM 12/6 | 1.5 | 0.024 |
| 7 PM 12/6 | 1.5 | 0.024 |
| 1 AM 12/7 | 1.5 | 0.024 |
| 7 AM 12/7 | 1.5 | 0.024 |
| 1 PM 12/7 | 1.5 | 0.024 |
| 7 PM 12/7 | 1.5 | 0.024 |
| 1 AM 12/8 | 1.5 | 0.024 |
| 7 AM 12/8 | 1.5 | 0.024 |
| 1 PM 12/8 | 1.5 | 0.024 |
| 7 PM 12/8 | 1.5 | 0.024 |
| 1 AM 12/9 | 1.5 | 0.024 |
| 7 AM 12/9 | 1.5 | 0.024 |
| Time | Stage (ft) | Flow (kcfs) |
|---|---|---|
| 11:45 PM 12/4 | 1.51 | 0.025 |
| 11:30 PM 12/4 | 1.51 | 0.025 |
| 11:15 PM 12/4 | 1.52 | 0.0261 |
| 11:00 PM 12/4 | 1.51 | 0.025 |
| 10:45 PM 12/4 | 1.51 | 0.025 |
| 10:30 PM 12/4 | 1.52 | 0.0261 |
| 10:15 PM 12/4 | 1.52 | 0.0261 |
| 10:00 PM 12/4 | 1.52 | 0.0261 |
| 9:45 PM 12/4 | 1.51 | 0.025 |
| 9:30 PM 12/4 | 1.52 | 0.0261 |
| 9:15 PM 12/4 | 1.52 | 0.0261 |
| 9:00 PM 12/4 | 1.53 | 0.0272 |
| 8:45 PM 12/4 | 1.52 | 0.0261 |
| 8:30 PM 12/4 | 1.52 | 0.0261 |
| 8:15 PM 12/4 | 1.52 | 0.0261 |
| 8:00 PM 12/4 | 1.53 | 0.0272 |
| 7:45 PM 12/4 | 1.53 | 0.0272 |
| 7:30 PM 12/4 | 1.53 | 0.0272 |
| 7:15 PM 12/4 | 1.53 | 0.0272 |
| 7:00 PM 12/4 | 1.53 | 0.0272 |
| 6:45 PM 12/4 | 1.53 | 0.0272 |
| 6:30 PM 12/4 | 1.53 | 0.0272 |
| 6:15 PM 12/4 | 1.53 | 0.0272 |
| 6:00 PM 12/4 | 1.53 | 0.0272 |
| 5:45 PM 12/4 | 1.53 | 0.0272 |
| 5:30 PM 12/4 | 1.54 | 0.0283 |
| 5:15 PM 12/4 | 1.54 | 0.0283 |
| 5:00 PM 12/4 | 1.54 | 0.0283 |
| 4:45 PM 12/4 | 1.54 | 0.0283 |
| 4:30 PM 12/4 | 1.54 | 0.0283 |
18.5' -
This would roughly equal the FEMA 500 year or 0.2 percent flood event. Significant flooding of homes on Plumtree and Edgecliff Drives in Mount Air occurs east of Route 315, with the Powell Waste Water Treatment Plant in southern Delaware County also flooded. Substantial flooding occurs along Rivers Edge Drive and Mount Air Place. Flooding would occur on The Ohio State campus, from along and north of Herrick Drive to Woody Hayes Drive, in areas west of Tuttle Park Place.
18' -
Widespread flooding occurs in sections of Worthington near the river, with homes flooded along Edgecliff and Plumtree Drives in Mount Air. Some flooding begins at the Powell Waste Water Treatment Plant.
17' -
This is above the FEMA 1 percent flood. Homes flood along Rosslyn and Kanawha Avenues and Tucker Drive in Worthington, with severe flooding along Edgecliff and Plumtree Drives in Mount Air, and along Olentangy River Road in Powell. Much of Olentangy Park and the bike trail are flooded. Flooding extends onto the back of properties along Masefield Street. The OhioHealth Primary Care facility also floods, with water also approaching the Powell Waste Water Treatment Plant. Whetstone High School may also flood.
15' -
Homes in Mt. Air are severely flooded along Edgecliff and Plumtree Drives close to the river, with Olentangy River Road flooded in areas from near Hyatts Road to Jewett Road. Flooding worsens near Worthington near Olentangy Park and along the bike trail.
13' -
Several homes along Edgecliff Drive in Mt. Air flood, and flooding worsens in low areas along the Olentangy River in Mount Air, and lowland areas near the river in Worthington experience flooding. Olentangy River Road near Powell also is flooded, with backwater flooding also affecting some side streets onto Olentangy River Road. Flooding in and near Worthington is confined to Olentangy Park and along the bike trail.
12' -
Homes along Edgecliff Drive in Mt. Air flood, as well as the playground of Olentangy Park. Olentangy River Road is flooded and impassible from near Powell Road to near Jewett Road.
11' -
Floodwater surrounds homes along Edgecliff Drive, as well as Plum Tree Drive in Worthington, cutting off residents.
10' -
Flood waters approach residences along the river in Mount Air, between Olentangy River Road and the river itself.
9' -
Flooding spreads further into yards of homes near the river in Mount Air, between Olentangy River Road and the river.
8' -
Flooding of yards begins along the Olentangy River near Mount Air in northern Franklin County, only in low-lying areas between Olentangy River Road and the river.
| Date | Stage (ft) |
|---|---|
| Jan 21, 1959 | 15.68 |
| Jan 10, 1952 | 15.3 |
| May 19, 2020 | 13.57 |
| Mar 10, 1964 | 12.66 |
| Jun 23, 2016 | 12.41 |
| Mar 4, 1963 | 11.68 |
| May 20, 1957 | 11.58 |
| Jun 20, 1973 | 11.55 |
| Jun 14, 2004 | 11.53 |
| Sep 14, 1979 | 11.45 |
| May 27, 1956 | 11.32 |
| May 22, 1969 | 11.23 |
| Jan 24, 1975 | 10.92 |
| Apr 25, 1961 | 10.61 |
| May 27, 1968 | 10.51 |
| Jul 3, 2019 | 10.37 |
| Jan 12, 2005 | 10.27 |
| Jul 14, 1966 | 10.25 |
| Dec 5, 2011 | 10.21 |
| Mar 14, 1967 | 10.19 |
Data provided by the National Weather Service.