Kalamazoo River at Comstock
Critical Stages
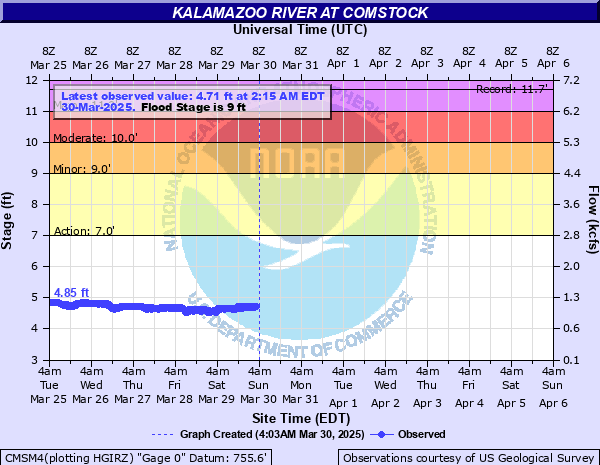
7' - Action
9' - Flood
10' - Moderate
11' - Major
Latest Observation
Updated: 5:15 PM EST 12/15/25
Status: No Flooding
Stage: 4.13 ft
Flow: 0.647 kcfs
Forecast
Forecast not available for this location.
| Time | Stage (ft) | Flow (kcfs) |
|---|---|---|
| 5:15 PM 12/15 | 4.13 | 0.647 |
| 5:00 PM 12/15 | 4.2 | 0.689 |
| 4:45 PM 12/15 | 4.18 | 0.677 |
| 4:30 PM 12/15 | 4.2 | 0.689 |
| 4:15 PM 12/15 | 4.2 | 0.689 |
| 4:00 PM 12/15 | 4.15 | 0.658 |
| 3:45 PM 12/15 | 4.18 | 0.677 |
| 3:30 PM 12/15 | 4.15 | 0.658 |
| 3:15 PM 12/15 | 4.15 | 0.658 |
| 3:00 PM 12/15 | 4.14 | 0.653 |
| 2:45 PM 12/15 | 4.12 | 0.641 |
| 2:30 PM 12/15 | 4.11 | 0.635 |
| 2:15 PM 12/15 | 4.12 | 0.641 |
| 2:00 PM 12/15 | 4.13 | 0.647 |
| 1:45 PM 12/15 | 4.14 | 0.653 |
| 1:30 PM 12/15 | 4.12 | 0.641 |
| 1:15 PM 12/15 | 4.13 | 0.647 |
| 1:00 PM 12/15 | 4.18 | 0.677 |
| 12:45 PM 12/15 | 4.13 | 0.647 |
| 12:30 PM 12/15 | 4.12 | 0.641 |
| 12:15 PM 12/15 | 4.12 | 0.641 |
| 12:00 PM 12/15 | 4.13 | 0.647 |
| 11:45 AM 12/15 | 4.17 | 0.671 |
| 11:30 AM 12/15 | 4.16 | 0.665 |
| 11:15 AM 12/15 | 4.16 | 0.665 |
| 11:00 AM 12/15 | 4.17 | 0.671 |
| 10:45 AM 12/15 | 4.19 | 0.683 |
| 10:30 AM 12/15 | 4.19 | 0.683 |
| 10:15 AM 12/15 | 4.19 | 0.683 |
| 10:00 AM 12/15 | 4.14 | 0.653 |
11' -
Expect extensive basement flooding and major flooding of businesses and the first floors of homes in the Portage Creek, Axtell Creek, and Gull Street areas in Kalamazoo.
10' -
Expect moderate flooding of homes along Portage Creek, near Gull Street and Recreation Park. Industrial areas in Kalamazoo begin to flood.
9' -
Expect minor flooding of low lying areas, the park in Comstock, and residential areas along Portage Creek, near Gull Street and the Recreation Park.
8' -
Expect minor flooding in park in Comstock.
7' -
River is bankfull.
| Date | Stage (ft) |
|---|---|
| Feb 25, 2018 | 11.69 |
| Apr 8, 1947 | 10.94 |
| Feb 28, 1985 | 10.91 |
| Sep 18, 2008 | 10.43 |
| Mar 19, 1982 | 10.2 |
| Mar 22, 1948 | 10.15 |
| Apr 22, 1975 | 10.04 |
| Apr 9, 2017 | 9.75 |
| Mar 30, 1950 | 9.65 |
| Jun 5, 1943 | 9.41 |
| Jun 4, 1989 | 9.37 |
| May 21, 2020 | 9.34 |
| Mar 12, 2009 | 9.14 |
| Jun 28, 1937 | 8.98 |
| Mar 15, 1990 | 8.79 |
| May 30, 2011 | 8.69 |
| Feb 14, 2001 | 8.64 |
| Mar 19, 1942 | 8.6 |
| May 25, 2004 | 8.57 |
| Jun 27, 2015 | 8.56 |
Data provided by the National Weather Service.