Sycamore Creek near Holt
Critical Stages
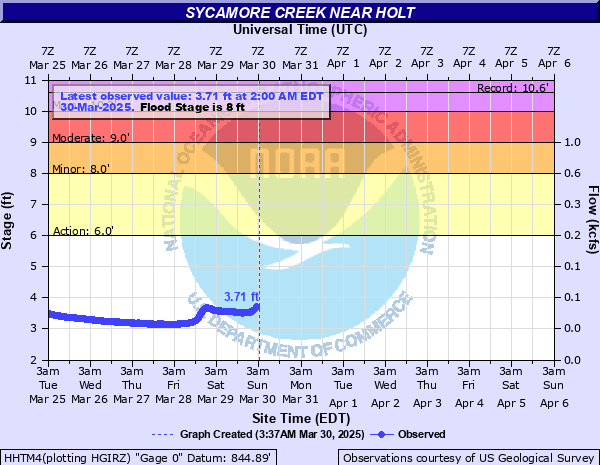
6' - Action
8' - Flood
9' - Moderate
10' - Major
Latest Observation
Updated: 5:00 PM EST 12/15/25
Status: No Flooding
Stage: 2.36 ft
Flow: 0.0182 kcfs
Forecast
Forecast not available for this location.
| Time | Stage (ft) | Flow (kcfs) |
|---|---|---|
| 5:00 PM 12/15 | 2.36 | 0.0182 |
| 4:45 PM 12/15 | 2.36 | 0.0182 |
| 4:30 PM 12/15 | 2.36 | 0.0182 |
| 4:15 PM 12/15 | 2.36 | 0.0182 |
| 4:00 PM 12/15 | 2.36 | 0.0182 |
| 3:45 PM 12/15 | 2.36 | 0.0182 |
| 3:30 PM 12/15 | 2.36 | 0.0182 |
| 3:15 PM 12/15 | 2.36 | 0.0182 |
| 3:00 PM 12/15 | 2.36 | 0.0182 |
| 2:45 PM 12/15 | 2.37 | 0.0184 |
| 2:30 PM 12/15 | 2.37 | 0.0184 |
| 2:15 PM 12/15 | 2.37 | 0.0184 |
| 2:00 PM 12/15 | 2.37 | 0.0184 |
| 1:45 PM 12/15 | 2.37 | 0.0184 |
| 1:30 PM 12/15 | 2.37 | 0.0184 |
| 1:15 PM 12/15 | 2.37 | 0.0184 |
| 1:00 PM 12/15 | 2.37 | 0.0184 |
| 12:45 PM 12/15 | 2.38 | 0.0186 |
| 12:30 PM 12/15 | 2.38 | 0.0186 |
| 12:15 PM 12/15 | 2.38 | 0.0186 |
| 12:00 PM 12/15 | 2.38 | 0.0186 |
| 11:45 AM 12/15 | 2.38 | 0.0186 |
| 11:30 AM 12/15 | 2.38 | 0.0186 |
| 11:15 AM 12/15 | 2.38 | 0.0186 |
| 11:00 AM 12/15 | 2.38 | 0.0186 |
| 10:45 AM 12/15 | 2.39 | 0.0188 |
| 10:30 AM 12/15 | 2.4 | 0.019 |
| 10:15 AM 12/15 | 2.39 | 0.0188 |
| 10:00 AM 12/15 | 2.4 | 0.019 |
| 9:45 AM 12/15 | 2.4 | 0.019 |
10' -
Expect major flooding of East Mt. Hope Road and homes along Sunnyside Ave, Willard Ave, Ruth Ave, Hoyt Ave and Cavanaugh Road, Boettcher Court, Jolly Road, and Aurelius Road.
8' -
Expect minor flooding of low lying areas adjacent to the river, in the Lansing Municipal Golf Course and sections of East Mt. Hope Road.
6' -
Flooding begins in low lying areas along the creek and at the Lansing Municipal Golf Course and Scott Woods Park.
| Date | Stage (ft) |
|---|---|
| Apr 4, 1947 | 10.6 |
| Apr 19, 1975 | 10 |
| Feb 21, 2018 | 9.8 |
| Feb 24, 1985 | 9.75 |
| Mar 13, 1982 | 9 |
| Jul 29, 2011 | 9 |
| Apr 7, 2017 | 8.82 |
| Jan 12, 2020 | 8.78 |
| Jun 21, 2019 | 8.78 |
| Feb 18, 2022 | 8.65 |
| Jul 11, 2024 | 8.59 |
| Mar 5, 1979 | 8.55 |
| May 13, 2018 | 8.5 |
| Feb 10, 2001 | 8.5 |
| Apr 20, 2013 | 8.4 |
| Apr 5, 2023 | 8.31 |
| Apr 6, 1985 | 8.3 |
| Dec 31, 2019 | 8.21 |
| Apr 24, 2022 | 8.15 |
| May 16, 2001 | 8.1 |
Data provided by the National Weather Service.