Kalamazoo River at Marshall
Critical Stages
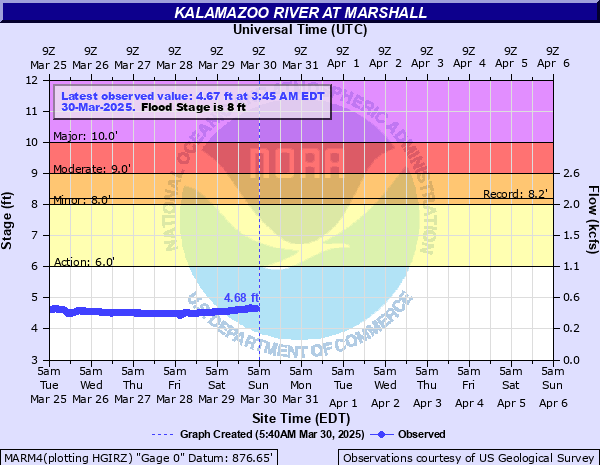
6' - Action
8' - Flood
9' - Moderate
10' - Major
Latest Observation
Updated: 5:45 PM EST 12/15/25
Status: No Flooding
Stage: 4.24 ft
Flow: 0.24 kcfs
Forecast
Forecast not available for this location.
| Time | Stage (ft) | Flow (kcfs) |
|---|---|---|
| 5:45 PM 12/15 | 4.24 | 0.24 |
| 5:30 PM 12/15 | 4.24 | 0.24 |
| 5:15 PM 12/15 | 4.24 | 0.24 |
| 5:00 PM 12/15 | 4.24 | 0.24 |
| 4:45 PM 12/15 | 4.24 | 0.24 |
| 4:30 PM 12/15 | 4.24 | 0.24 |
| 4:15 PM 12/15 | 4.25 | 0.243 |
| 4:00 PM 12/15 | 4.25 | 0.243 |
| 3:45 PM 12/15 | 4.25 | 0.243 |
| 3:30 PM 12/15 | 4.25 | 0.243 |
| 3:15 PM 12/15 | 4.25 | 0.243 |
| 3:00 PM 12/15 | 4.25 | 0.243 |
| 2:45 PM 12/15 | 4.26 | 0.246 |
| 2:30 PM 12/15 | 4.26 | 0.246 |
| 2:15 PM 12/15 | 4.27 | 0.249 |
| 2:00 PM 12/15 | 4.27 | 0.249 |
| 1:45 PM 12/15 | 4.29 | 0.255 |
| 1:30 PM 12/15 | 4.3 | 0.258 |
| 1:15 PM 12/15 | 4.33 | 0.268 |
| 1:00 PM 12/15 | 4.36 | 0.277 |
| 12:45 PM 12/15 | 4.37 | 0.281 |
| 12:30 PM 12/15 | 4.37 | 0.281 |
| 12:15 PM 12/15 | 4.38 | 0.284 |
| 12:00 PM 12/15 | 4.38 | 0.284 |
| 11:45 AM 12/15 | 4.37 | 0.281 |
| 11:30 AM 12/15 | 4.32 | 0.264 |
| 11:15 AM 12/15 | 4.18 | 0.222 |
| 11:00 AM 12/15 | 3.97 | 0.165 |
| 10:45 AM 12/15 | 3.95 | 0.16 |
| 10:30 AM 12/15 | 3.94 | 0.158 |
10' -
Expect major flooding of residences and apartments in low lying areas adjacent to the river.
9' -
Expect moderate flooding of residences and apartments in low lying areas adjacent to the river.
8' -
Expect minor flooding of residences and apartments in low lying areas adjacent to the river.
6' -
River is bankfull. Expect minor flooding of farmland and pastures adjacent to the river.
| Date | Stage (ft) |
|---|---|
| Mar 29, 1950 | 8.2 |
| Sep 15, 2008 | 7.89 |
| Mar 22, 1948 | 7.85 |
| Feb 22, 2018 | 7.47 |
| Jul 25, 2010 | 7.44 |
| Feb 16, 1949 | 7.41 |
| Mar 17, 1982 | 7.4 |
| Jul 12, 2024 | 7.32 |
| May 20, 2020 | 7.14 |
| Mar 5, 1976 | 7.03 |
| Mar 12, 2009 | 6.99 |
| Feb 22, 1971 | 6.9 |
| Mar 10, 1974 | 6.86 |
| Jun 30, 1968 | 6.86 |
| May 1, 1956 | 6.73 |
| Apr 16, 1952 | 6.72 |
| Apr 7, 2017 | 6.68 |
| Jan 2, 1973 | 6.67 |
| May 29, 2011 | 6.48 |
| Apr 20, 2013 | 6.45 |
Data provided by the National Weather Service.