Beaver Creek (IN) near Shoals
Critical Stages
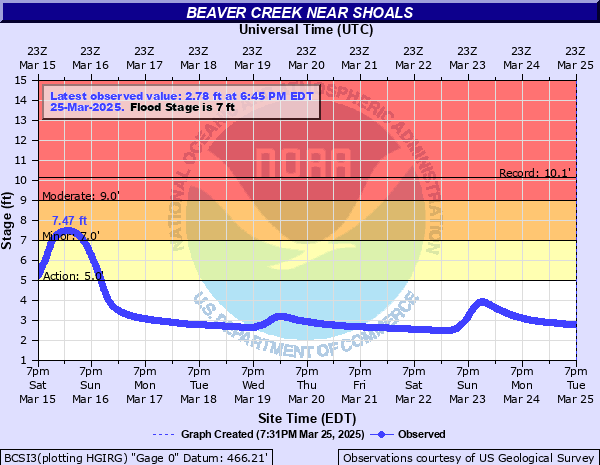
5' - Action
7' - Flood
9' - Moderate
Major
Latest Observation
Updated: 10:45 AM EST 12/6/25
Status: No Flooding
Stage: 1.79 ft
Flow: -999 kcfs
Forecast
Forecast not available for this location.
| Time | Stage (ft) | Flow (kcfs) |
|---|---|---|
| 10:45 AM 12/6 | 1.79 | -999 |
| 10:30 AM 12/6 | 1.79 | -999 |
| 10:15 AM 12/6 | 1.79 | -999 |
| 10:00 AM 12/6 | 1.79 | -999 |
| 9:45 AM 12/6 | 1.79 | -999 |
| 9:30 AM 12/6 | 1.79 | -999 |
| 9:15 AM 12/6 | 1.79 | -999 |
| 9:00 AM 12/6 | 1.79 | -999 |
| 8:45 AM 12/6 | 1.79 | -999 |
| 8:30 AM 12/6 | 1.79 | -999 |
| 8:15 AM 12/6 | 1.8 | -999 |
| 8:00 AM 12/6 | 1.8 | -999 |
| 7:45 AM 12/6 | 1.8 | -999 |
| 7:30 AM 12/6 | 1.8 | -999 |
| 7:15 AM 12/6 | 1.8 | -999 |
| 7:00 AM 12/6 | 1.8 | -999 |
| 6:45 AM 12/6 | 1.8 | -999 |
| 6:30 AM 12/6 | 1.8 | -999 |
| 6:15 AM 12/6 | 1.8 | -999 |
| 6:00 AM 12/6 | 1.8 | -999 |
| 5:45 AM 12/6 | 1.8 | -999 |
| 5:30 AM 12/6 | 1.8 | -999 |
| 5:15 AM 12/6 | 1.8 | -999 |
| 5:00 AM 12/6 | 1.8 | -999 |
| 4:45 AM 12/6 | 1.8 | -999 |
| 4:30 AM 12/6 | 1.8 | -999 |
| 4:15 AM 12/6 | 1.8 | -999 |
| 4:00 AM 12/6 | 1.8 | -999 |
| 3:45 AM 12/6 | 1.8 | -999 |
| 3:30 AM 12/6 | 1.8 | -999 |
10.1' -
Many local roads flood. This is the level reached in March 2008 that prompted Martin County to declare a local emergency because of the local roads that flooded.
9' -
Flooding along Beaver Creek in the SR 150 area nears the top of the highway grade. Extensive flooding by several feet of water to surrounding residential and commercial area that is substantially lower than the highway. An estimated level that backwater would reach if the March 1913 flood at Shoals returned.
7.3' -
Local roads may flood when this level is reached.
5.2' -
During the March 2008 flood, backwater from the East Fork White River reached this level. The crest on the East Fork White at Shoals was around 30 feet, and the backwater from it caused flooding along Beaver Creek in and around SR 150.
| Date | Stage (ft) |
|---|---|
| Mar 19, 2008 | 10.13 |
| Jul 23, 2017 | 9.94 |
| Jun 26, 2011 | 9.79 |
| Dec 22, 2013 | 9.59 |
| Jul 17, 2021 | 9.56 |
| Feb 25, 2018 | 9.08 |
| Mar 4, 2023 | 9.06 |
| Jan 9, 2008 | 9.01 |
| Mar 14, 2015 | 8.97 |
| Apr 6, 2025 | 8.95 |
| Jun 20, 2015 | 8.79 |
| May 2, 2011 | 8.75 |
| Jan 13, 2013 | 8.47 |
| Apr 4, 2014 | 8.3 |
| Feb 8, 2019 | 8.29 |
| May 18, 2020 | 8.28 |
| Feb 6, 2008 | 8.28 |
| May 5, 2017 | 8.15 |
| Aug 2, 2020 | 8.13 |
| Apr 26, 2019 | 7.87 |
Data provided by the National Weather Service.