Embarras River (IL) at Lawrenceville
Critical Stages
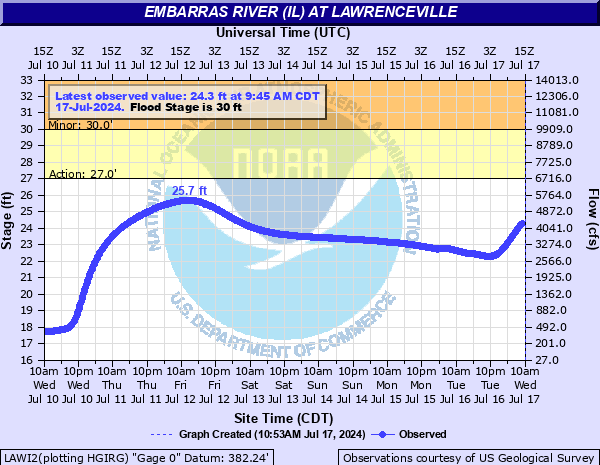
27' - Action
30' - Flood
37' - Moderate
41' - Major
Latest Observation
Updated: 9:45 AM CST 12/6/25
Status: No Flooding
Stage: 16.72 ft
Flow: 0.07 kcfs
Forecast
Forecast not available for this location.
| Time | Stage (ft) | Flow (kcfs) |
|---|---|---|
| 9:45 AM 12/6 | 16.72 | 0.07 |
| 9:30 AM 12/6 | 16.72 | 0.07 |
| 9:15 AM 12/6 | 16.72 | 0.07 |
| 9:00 AM 12/6 | 16.72 | 0.07 |
| 8:45 AM 12/6 | 16.72 | 0.07 |
| 8:30 AM 12/6 | 16.72 | 0.07 |
| 8:15 AM 12/6 | 16.72 | 0.07 |
| 8:00 AM 12/6 | 16.72 | 0.07 |
| 7:45 AM 12/6 | 16.73 | 0.0718 |
| 7:30 AM 12/6 | 16.73 | 0.0718 |
| 7:15 AM 12/6 | 16.72 | 0.07 |
| 7:00 AM 12/6 | 16.73 | 0.0718 |
| 6:45 AM 12/6 | 16.72 | 0.07 |
| 6:30 AM 12/6 | 16.72 | 0.07 |
| 6:15 AM 12/6 | 16.73 | 0.0718 |
| 6:00 AM 12/6 | 16.73 | 0.0718 |
| 5:45 AM 12/6 | 16.73 | 0.0718 |
| 5:30 AM 12/6 | 16.73 | 0.0718 |
| 5:15 AM 12/6 | 16.73 | 0.0718 |
| 5:00 AM 12/6 | 16.73 | 0.0718 |
| 4:45 AM 12/6 | 16.73 | 0.0718 |
| 4:30 AM 12/6 | 16.73 | 0.0718 |
| 4:15 AM 12/6 | 16.73 | 0.0718 |
| 4:00 AM 12/6 | 16.73 | 0.0718 |
| 3:45 AM 12/6 | 16.73 | 0.0718 |
| 3:30 AM 12/6 | 16.73 | 0.0718 |
| 3:15 AM 12/6 | 16.73 | 0.0718 |
| 3:00 AM 12/6 | 16.73 | 0.0718 |
| 2:45 AM 12/6 | 16.73 | 0.0718 |
| 2:30 AM 12/6 | 16.72 | 0.07 |
47' -
Water overtops some levees in the area.
44' -
4th Street is inundated in Lawrenceville. 11-12 families evacuated.
43' -
Old U.S. Route 50 is inundated from 3 miles west of Vincennes.
41.3' -
4th Street covered between State and Jefferson. The intersection between 4th and Cedar inundated. 3rd Street completely inundated.
41' -
Old railroad grade north of Lawrenceville completely covered.
40' -
10th Street and parts of 3rd Street in Lawrenceville are inundated.
37' -
The road across Poteet Bridge floods. Some houses are isolated.
36' -
Billet-Vincennes River road is inundated.
33' -
Kelly's Lake Lane, 1160N, is inundated.
30' -
Minor agricultural flooding begins.
| Date | Stage (ft) |
|---|---|
| Jun 10, 2008 | 42.61 |
| May 16, 2002 | 41.61 |
| Apr 30, 2011 | 40.82 |
| Jan 8, 2005 | 40.73 |
| May 8, 2017 | 40.64 |
| Jan 1, 2016 | 40.29 |
| Apr 27, 2013 | 38.99 |
| Apr 8, 2025 | 38.95 |
| Jan 16, 2020 | 37.71 |
| Feb 15, 2009 | 37.22 |
| Jul 3, 2013 | 36.79 |
| Apr 8, 2018 | 36.5 |
| Jun 16, 2018 | 36.31 |
| Jan 18, 2007 | 36.15 |
| Mar 29, 2023 | 36.01 |
| Mar 9, 2011 | 35.93 |
| Apr 6, 2014 | 35.93 |
| Mar 1, 2018 | 35.83 |
| Jun 25, 2015 | 35.42 |
| Feb 10, 2019 | 35.37 |
Data provided by the National Weather Service.