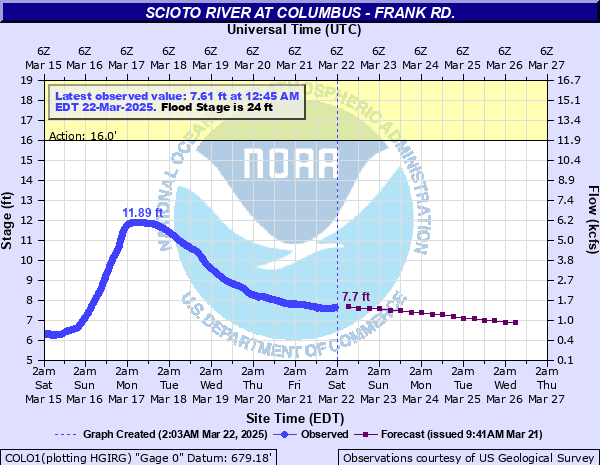
Scioto River at Frank Road
Critical Stages
16' - Action
24' - Flood
25' - Moderate
27' - Major
Latest Observation
Updated: 11:45 PM EST 12/4/25
Status: No Flooding
Stage: 5.32 ft
Flow: 0.191 kcfs
Forecast
| Time | Stage (ft) | Flow (kcfs) |
|---|---|---|
| 1 AM 12/5 | 5.3 | 0.185 |
| 7 AM 12/5 | 5.3 | 0.185 |
| 1 PM 12/5 | 5.3 | 0.185 |
| 7 PM 12/5 | 5.3 | 0.185 |
| 1 AM 12/6 | 5.3 | 0.185 |
| 7 AM 12/6 | 5.3 | 0.185 |
| 1 PM 12/6 | 5.3 | 0.185 |
| 7 PM 12/6 | 5.3 | 0.185 |
| 1 AM 12/7 | 5.3 | 0.185 |
| 7 AM 12/7 | 5.3 | 0.185 |
| 1 PM 12/7 | 5.3 | 0.185 |
| 7 PM 12/7 | 5.3 | 0.185 |
| 1 AM 12/8 | 5.3 | 0.185 |
| 7 AM 12/8 | 5.3 | 0.185 |
| 1 PM 12/8 | 5.3 | 0.185 |
| 7 PM 12/8 | 5.2 | 0.158 |
| 1 AM 12/9 | 5.2 | 0.158 |
| 7 AM 12/9 | 5.2 | 0.158 |
| Time | Stage (ft) | Flow (kcfs) |
|---|---|---|
| 11:45 PM 12/4 | 5.32 | 0.191 |
| 11:30 PM 12/4 | 5.32 | 0.191 |
| 11:15 PM 12/4 | 5.32 | 0.191 |
| 11:00 PM 12/4 | 5.32 | 0.191 |
| 10:45 PM 12/4 | 5.33 | 0.194 |
| 10:30 PM 12/4 | 5.33 | 0.194 |
| 10:15 PM 12/4 | 5.33 | 0.194 |
| 10:00 PM 12/4 | 5.33 | 0.194 |
| 9:45 PM 12/4 | 5.33 | 0.194 |
| 9:30 PM 12/4 | 5.33 | 0.194 |
| 9:15 PM 12/4 | 5.33 | 0.194 |
| 9:00 PM 12/4 | 5.34 | 0.197 |
| 8:45 PM 12/4 | 5.34 | 0.197 |
| 8:30 PM 12/4 | 5.33 | 0.194 |
| 8:15 PM 12/4 | 5.33 | 0.194 |
| 8:00 PM 12/4 | 5.33 | 0.194 |
| 7:45 PM 12/4 | 5.32 | 0.191 |
| 7:30 PM 12/4 | 5.32 | 0.191 |
| 7:15 PM 12/4 | 5.31 | 0.188 |
| 7:00 PM 12/4 | 5.3 | 0.185 |
| 6:45 PM 12/4 | 5.3 | 0.185 |
| 6:30 PM 12/4 | 5.29 | 0.182 |
| 6:15 PM 12/4 | 5.28 | 0.18 |
| 6:00 PM 12/4 | 5.27 | 0.177 |
| 5:45 PM 12/4 | 5.27 | 0.177 |
| 5:30 PM 12/4 | 5.26 | 0.174 |
| 5:15 PM 12/4 | 5.26 | 0.174 |
| 5:00 PM 12/4 | 5.26 | 0.174 |
| 4:45 PM 12/4 | 5.25 | 0.171 |
| 4:30 PM 12/4 | 5.25 | 0.171 |
30' -
Widespread flooding near the river outside the Franklinton flood wall protection occurs. The flood wall protects the west bank of the river to 30.9 feet, with flooding in the Brewery District along and west of Short Street, and the Arena District closest to the river along West Spring and West Long Streets. Flooding in this area is confined to west of Neil Avenue. Extensive flooding occurs along and west of Riverside. Much of Jackson Pike floods, as well as areas of West Mound Street and Frank Road.
28.8' -
This is approximately equivalent to the FEMA 1 percent flood. Portions of Greenlawn Avenue flood, as well as Lou Berliner Park and some businesses in the Brewery District along Short Street. Portions of the Jackson Pike Wastewater treatment plant are flooded. In addition, some businesses are flooded in the River South District near West Mound Street west of Front Street.
28.5' -
Portions of Greenlawn Avenue flood, as well as Lou Berliner Park and some businesses in the Brewery District along Short Street. Floodwall closures shut down Route 315, Greenlawn, Harmon and McKinley Roads. Portions of the Jackson Pike Wastewater treatment plant are flooded. In addition, some businesses are flooded in the River South District near West Mound Street west of Front Street.
27.2' -
Major river flooding outside the City of Columbus occurs. While the city itself is protected at stages above this level, the Franklinton flood wall closes off several roadways, including potentially Route 315.
27' -
Major river flooding outside the City of Columbus occurs. While the city itself is protected at stages above this level, the Franklinton flood wall closes off several roadways, including McKinley, Harmon and Greenlawn Avenues.
26' -
Lowland flooding worsens, especially in Marion Township near the Scioto River. The City of Columbus continues to erect the Franklinton flood wall to protect the city itself from flooding. The Franklinton flood wall and levee system protects the city to a stage of 30.9 feet. Outside the flood wall, moderate flooding occurs, with high water throughout Franklin County.
24' -
While much of the city remains protected at this stage, flooding occurs along the river outside the City of Columbus. A stage of this level will cause flooding along the Scioto River in southern Franklin County, mainly in Franklin and Jackson townships, as well as areas near Haul Road in south Columbus. McKinley Avenue is closed at 24.2 feet due to floodgate closure. Route 23 High Street is flooded near I-270.
22' -
U.S. 23 is flooded near I-270.
21' -
High water impacts the ramp from Interstate 270 east to Route 23 north on the south side of Columbus.
| Date | Stage (ft) |
|---|---|
| Jan 22, 1959 | 27.22 |
| Jan 6, 2005 | 26.61 |
| Feb 24, 1975 | 24.88 |
| Jun 2, 1997 | 24.78 |
| Jan 27, 1952 | 24.7 |
| Mar 21, 1927 | 24.7 |
| Jan 15, 1937 | 24.5 |
| Dec 31, 1990 | 24.45 |
| Mar 14, 1933 | 24.32 |
| May 19, 2020 | 24.2 |
| Jun 20, 1973 | 24.12 |
| Apr 4, 2018 | 23.95 |
| Dec 22, 2013 | 23.9 |
| Jan 1, 1964 | 23.88 |
| Feb 26, 1929 | 23.84 |
| Mar 5, 1963 | 23.47 |
| Sep 14, 1979 | 23.41 |
| Jan 12, 2005 | 22.95 |
| Dec 6, 2011 | 22.72 |
| Mar 3, 1947 | 22.71 |
Data provided by the National Weather Service.