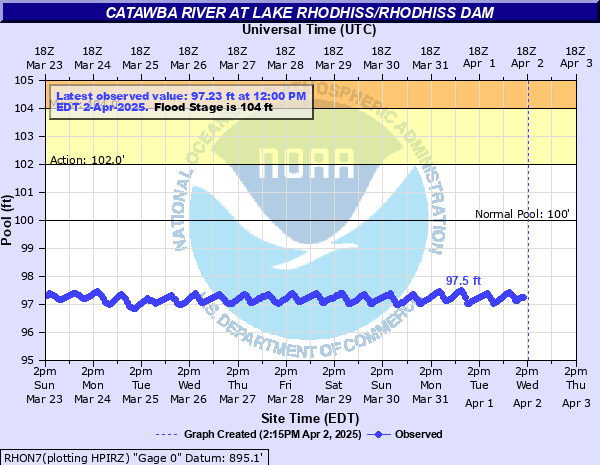
Catawba River at Lake Rhodhiss/Rhodhiss Dam
Critical Stages
102' - Action
104' - Flood
106' - Moderate
110' - Major
Latest Observation
Updated: 9:00 AM EST 12/6/25
Status: No Flooding
Stage: 97.08 ft
Flow: -999 kcfs
Forecast
Forecast not available for this location.
| Time | Stage (ft) | Flow (kcfs) |
|---|---|---|
| 9:00 AM 12/6 | 97.08 | -999 |
| 8:00 AM 12/6 | 97.23 | -999 |
| 7:00 AM 12/6 | 97.37 | -999 |
| 6:00 AM 12/6 | 97.46 | -999 |
| 5:00 AM 12/6 | 97.55 | -999 |
| 4:00 AM 12/6 | 97.51 | -999 |
| 3:00 AM 12/6 | 97.49 | -999 |
| 2:00 AM 12/6 | 97.45 | -999 |
| 1:00 AM 12/6 | 97.42 | -999 |
| 12:00 AM 12/6 | 97.39 | -999 |
| 11:00 PM 12/5 | 97.36 | -999 |
| 10:00 PM 12/5 | 97.33 | -999 |
| 9:00 PM 12/5 | 97.28 | -999 |
| 8:00 PM 12/5 | 97.29 | -999 |
| 7:00 PM 12/5 | 97.45 | -999 |
| 6:00 PM 12/5 | 97.58 | -999 |
| 5:00 PM 12/5 | 97.66 | -999 |
| 4:00 PM 12/5 | 97.75 | -999 |
| 3:00 PM 12/5 | 97.72 | -999 |
| 2:00 PM 12/5 | 97.7 | -999 |
| 1:00 PM 12/5 | 97.67 | -999 |
| 12:00 PM 12/5 | 97.64 | -999 |
| 11:00 AM 12/5 | 97.61 | -999 |
| 10:00 AM 12/5 | 97.59 | -999 |
| 9:00 AM 12/5 | 97.55 | -999 |
| 8:00 AM 12/5 | 97.52 | -999 |
| 7:00 AM 12/5 | 97.49 | -999 |
| 6:00 AM 12/5 | 97.46 | -999 |
| 5:00 AM 12/5 | 97.42 | -999 |
| 4:00 AM 12/5 | 97.39 | -999 |
104' -
Minor Flood Stage. Floodwaters may approach homes and businesses between Morganton and Lake Rhodhiss. Backwater effects will impact several tributaries including Silver Creek and Lower Creek, causing flooding of low-lying areas along the tributaries, including at Antioch Rd. River access points will be flooded, including at Huffman Bridge Rd. The Catawba River Greenway near Morganton is likely flooded as well.
103' -
Action/Advisory Stage flooding continues. Backwater effects may impact several tributaries including Silver Creek and Lower Creek, causing flooding of low-lying areas along the tributaries, including at Antioch Rd. River access points will be flooded, including at Huffman Bridge Rd. The Catawba River Greenway near Morganton may be flooded as well.
100' -
Full Pool.
| Date | Stage (ft) |
|---|---|
| Aug 30, 1940 | 110.1 |
| Sep 28, 2024 | 109.62 |
| Sep 9, 2004 | 107.41 |
| May 6, 2013 | 105.34 |
| Jan 15, 1995 | 105.33 |
| Aug 17, 1994 | 104.9 |
| Jun 10, 2019 | 104.17 |
| Mar 1, 1987 | 103.7 |
| Oct 13, 1990 | 103.7 |
| Jan 25, 2010 | 103.24 |
| Mar 24, 1993 | 103.2 |
| Sep 18, 2004 | 103.01 |
| Oct 1, 1989 | 102.2 |
| Jan 27, 1996 | 102.1 |
| Mar 30, 1991 | 102 |
| Apr 11, 2003 | 101.91 |
| Feb 12, 2018 | 101.73 |
| Apr 22, 1992 | 101.3 |
| Jan 8, 1998 | 101.28 |
| Dec 25, 2015 | 101.27 |
Data provided by the National Weather Service.