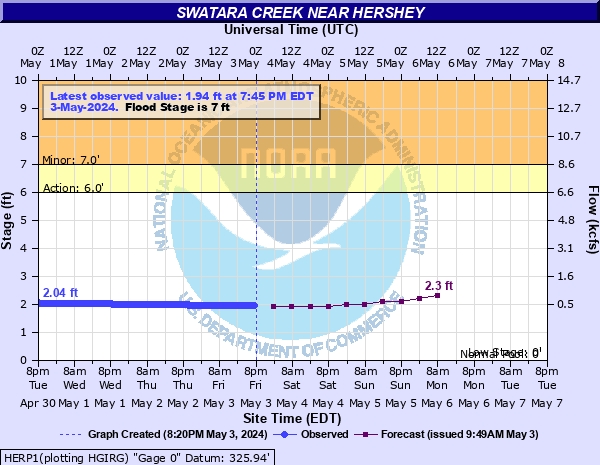
Swatara Creek near Hershey
Critical Stages
6' - Action
7' - Flood
10' - Moderate
14' - Major
Latest Observation
Updated: 8:45 AM EST 12/6/25
Status: No Flooding
Stage: 1.75 ft
Flow: 0.231 kcfs
Forecast
| Time | Stage (ft) | Flow (kcfs) |
|---|---|---|
| 1 PM 12/6 | 1.7 | 0.196 |
| 7 PM 12/6 | 1.7 | 0.196 |
| 1 AM 12/7 | 1.7 | 0.196 |
| 7 AM 12/7 | 1.7 | 0.196 |
| 1 PM 12/7 | 1.7 | 0.196 |
| 7 PM 12/7 | 1.7 | 0.196 |
| 1 AM 12/8 | 1.7 | 0.196 |
| 7 AM 12/8 | 1.7 | 0.196 |
| Time | Stage (ft) | Flow (kcfs) |
|---|---|---|
| 8:45 AM 12/6 | 1.75 | 0.231 |
| 8:30 AM 12/6 | 1.75 | 0.231 |
| 8:15 AM 12/6 | 1.75 | 0.231 |
| 8:00 AM 12/6 | 1.75 | 0.231 |
| 7:45 AM 12/6 | 1.75 | 0.231 |
| 7:30 AM 12/6 | 1.75 | 0.231 |
| 7:15 AM 12/6 | 1.75 | 0.231 |
| 7:00 AM 12/6 | 1.75 | 0.231 |
| 6:45 AM 12/6 | 1.75 | 0.231 |
| 6:30 AM 12/6 | 1.75 | 0.231 |
| 6:15 AM 12/6 | 1.75 | 0.231 |
| 6:00 AM 12/6 | 1.75 | 0.231 |
| 5:45 AM 12/6 | 1.75 | 0.231 |
| 5:30 AM 12/6 | 1.75 | 0.231 |
| 5:15 AM 12/6 | 1.75 | 0.231 |
| 5:00 AM 12/6 | 1.75 | 0.231 |
| 4:45 AM 12/6 | 1.75 | 0.231 |
| 4:30 AM 12/6 | 1.75 | 0.231 |
| 4:15 AM 12/6 | 1.75 | 0.231 |
| 4:00 AM 12/6 | 1.75 | 0.231 |
| 3:45 AM 12/6 | 1.75 | 0.231 |
| 3:30 AM 12/6 | 1.75 | 0.231 |
| 3:15 AM 12/6 | 1.75 | 0.231 |
| 3:00 AM 12/6 | 1.75 | 0.231 |
| 2:45 AM 12/6 | 1.75 | 0.231 |
| 2:30 AM 12/6 | 1.75 | 0.231 |
| 2:15 AM 12/6 | 1.75 | 0.231 |
| 2:00 AM 12/6 | 1.75 | 0.231 |
| 1:45 AM 12/6 | 1.75 | 0.231 |
| 1:30 AM 12/6 | 1.75 | 0.231 |
27' -
FEMA 0.2 0X0P+0nnual Chance Flood Level (500-year flood).
26.8' -
Flood of record from the flooding in September, 2011. Maximum recordable gage height (stage sensor operational limit). Water levels above this stage will not be reported in real time.
20' -
FEMA 1 0X0P+0nnual Chance Flood Level (100-year flood).
18' -
Flood waters begin to reach the Route 39 Bridge (Hershey Road) northwest of Hershey. FEMA 2 0X0P+0nnual Chance Flood Level (50-year flood).
16' -
Numerous homes adjacent to the creek are affected by high water.
14' -
Numerous homes adjacent to the creek are affected by high water.
12' -
High water affects several homes upstream of the Route 39 bridge. FEMA 10 0X0P+0nnual Chance Flood Level (10-year flood).
10' -
A few homes adjacent to the creek upstream of the Route 39 bridge flood.
8' -
The right, or north bank overflows. Several roads are affected.
7' -
The right, or north bank begins to overflow. Several roadways upstream of the gage are affected by high water.
| Date | Stage (ft) |
|---|---|
| Sep 8, 2011 | 26.8 |
| Jul 26, 2018 | 17.08 |
| Jun 29, 2006 | 16.12 |
| Sep 27, 1975 | 15.36 |
| Jan 25, 1979 | 14.43 |
| Jan 20, 1996 | 14.3 |
| Sep 19, 2004 | 14.27 |
| Sep 3, 2021 | 14.01 |
| Mar 12, 2011 | 10.97 |
| Nov 29, 1993 | 10.33 |
| Jan 21, 1996 | 10.239999771118 |
| Apr 16, 1983 | 9.45 |
| Jan 27, 1976 | 9.44 |
| Aug 14, 2018 | 9.24 |
| Jan 27, 1978 | 9.19 |
| Oct 10, 1976 | 9.18 |
| Jan 28, 1996 | 9.1099996566772 |
| Feb 26, 1979 | 8.94 |
| Dec 26, 2020 | 8.94 |
| Nov 2, 2019 | 8.52 |
Data provided by the National Weather Service.