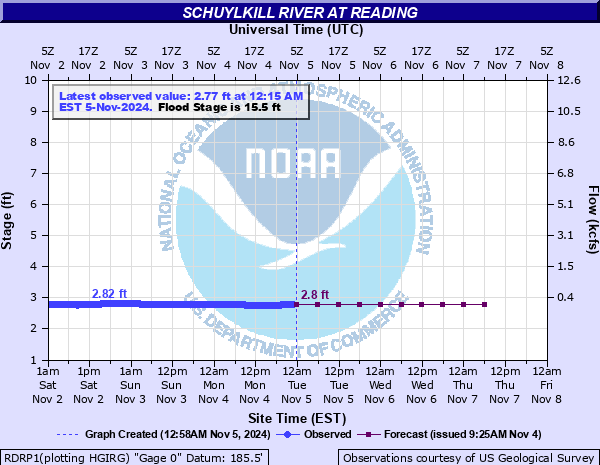
Schuylkill River at Reading
Critical Stages
14.5' - Action
15.5' - Flood
18' - Moderate
22' - Major
Latest Observation
Updated: 8:15 AM EST 12/6/25
Status: No Flooding
Stage: 3.03 ft
Flow: 0.412 kcfs
Forecast
| Time | Stage (ft) | Flow (kcfs) |
|---|---|---|
| 1 PM 12/6 | 3 | 0.393 |
| 7 PM 12/6 | 3 | 0.393 |
| 1 AM 12/7 | 3 | 0.393 |
| 7 AM 12/7 | 3.1 | 0.46 |
| 1 PM 12/7 | 3.1 | 0.46 |
| 7 PM 12/7 | 3.1 | 0.46 |
| 1 AM 12/8 | 3 | 0.393 |
| 7 AM 12/8 | 3.1 | 0.46 |
| Time | Stage (ft) | Flow (kcfs) |
|---|---|---|
| 8:15 AM 12/6 | 3.03 | 0.412 |
| 8:00 AM 12/6 | 3.03 | 0.412 |
| 7:45 AM 12/6 | 3.03 | 0.412 |
| 7:30 AM 12/6 | 3.03 | 0.412 |
| 7:15 AM 12/6 | 3.03 | 0.412 |
| 7:00 AM 12/6 | 3.03 | 0.412 |
| 6:45 AM 12/6 | 3.03 | 0.412 |
| 6:30 AM 12/6 | 3.03 | 0.412 |
| 6:15 AM 12/6 | 3.03 | 0.412 |
| 6:00 AM 12/6 | 3.04 | 0.419 |
| 5:45 AM 12/6 | 3.03 | 0.412 |
| 5:30 AM 12/6 | 3.04 | 0.419 |
| 5:15 AM 12/6 | 3.03 | 0.412 |
| 5:00 AM 12/6 | 3.04 | 0.419 |
| 4:45 AM 12/6 | 3.03 | 0.412 |
| 4:30 AM 12/6 | 3.04 | 0.419 |
| 4:15 AM 12/6 | 3.04 | 0.419 |
| 4:00 AM 12/6 | 3.04 | 0.419 |
| 3:45 AM 12/6 | 3.04 | 0.419 |
| 3:30 AM 12/6 | 3.04 | 0.419 |
| 3:15 AM 12/6 | 3.04 | 0.419 |
| 3:00 AM 12/6 | 3.04 | 0.419 |
| 2:45 AM 12/6 | 3.04 | 0.419 |
| 2:30 AM 12/6 | 3.04 | 0.419 |
| 2:15 AM 12/6 | 3.04 | 0.419 |
| 2:00 AM 12/6 | 3.04 | 0.419 |
| 1:45 AM 12/6 | 3.04 | 0.419 |
| 1:30 AM 12/6 | 3.05 | 0.425 |
| 1:15 AM 12/6 | 3.04 | 0.419 |
| 1:00 AM 12/6 | 3.05 | 0.425 |
26' -
The Penn Street ramps in West Reading are flooded.
22' -
Flooding spreads in Reading with more roads flooded, including the east and west bound lanes of US 222/422 (West Shore Bypass). The Conrail tracks in West Reading are inundated.
18' -
Additional streets in Reading are closed. West Reading begins to experience street flooding. The Reading Conrail tracks are also flooded.
16' -
Flooding occurs along portions of Franklin, Grape and Chestnut Streets in Reading.
15.5' -
Flooding begins in Reading. Portions of Water and Canal Streets are flooded.
| Date | Stage (ft) |
|---|---|
| Jun 22, 1972 | 31.3 |
| Jun 28, 2006 | 23.75 |
| Sep 8, 2011 | 20.4 |
| Apr 16, 1983 | 17.5 |
| Jan 25, 1979 | 17.36 |
| Sep 2, 2021 | 16.95 |
| Sep 18, 2004 | 16.24 |
| Dec 14, 1983 | 16.09 |
| Jan 20, 1996 | 15.85 |
| Oct 20, 1996 | 15.83 |
| Jan 28, 1996 | 15.02 |
| Mar 11, 2011 | 15.01 |
| Sep 17, 1999 | 14.95 |
| Dec 2, 1996 | 13.7 |
| Apr 3, 2005 | 12.84 |
| Dec 17, 2000 | 12.44 |
| Aug 13, 2004 | 12.18 |
| May 1, 2014 | 11.57 |
| Aug 29, 2011 | 10.05 |
Data provided by the National Weather Service.