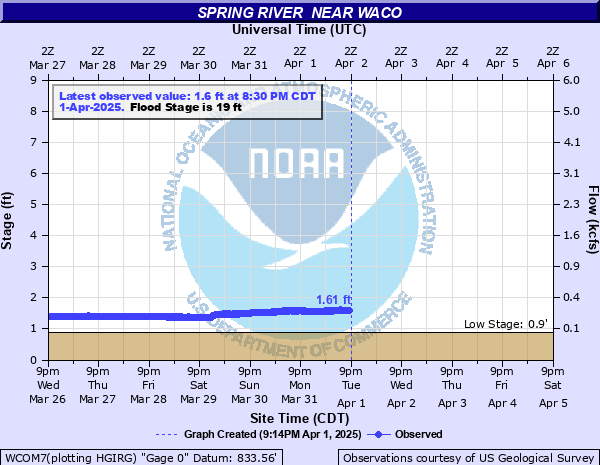
Spring River near Waco
Critical Stages
15' - Action
19' - Flood
30' - Moderate
33' - Major
Latest Observation
Updated: 5:30 PM CST 12/15/25
Status: No Flooding
Stage: 1.09 ft
Flow: 0.0787 kcfs
Forecast
Forecast not available for this location.
| Time | Stage (ft) | Flow (kcfs) |
|---|---|---|
| 5:30 PM 12/15 | 1.09 | 0.0787 |
| 5:15 PM 12/15 | 1.09 | 0.0787 |
| 5:00 PM 12/15 | 1.09 | 0.0787 |
| 4:45 PM 12/15 | 1.09 | 0.0787 |
| 4:30 PM 12/15 | 1.1 | 0.0807 |
| 4:15 PM 12/15 | 1.09 | 0.0787 |
| 4:00 PM 12/15 | 1.09 | 0.0787 |
| 3:45 PM 12/15 | 1.09 | 0.0787 |
| 3:30 PM 12/15 | 1.1 | 0.0807 |
| 3:15 PM 12/15 | 1.09 | 0.0787 |
| 3:00 PM 12/15 | 1.09 | 0.0787 |
| 2:45 PM 12/15 | 1.09 | 0.0787 |
| 2:30 PM 12/15 | 1.1 | 0.0807 |
| 2:15 PM 12/15 | 1.1 | 0.0807 |
| 2:00 PM 12/15 | 1.1 | 0.0807 |
| 1:45 PM 12/15 | 1.09 | 0.0787 |
| 1:30 PM 12/15 | 1.1 | 0.0807 |
| 1:15 PM 12/15 | 1.09 | 0.0787 |
| 1:00 PM 12/15 | 1.1 | 0.0807 |
| 12:45 PM 12/15 | 1.1 | 0.0807 |
| 12:30 PM 12/15 | 1.09 | 0.0787 |
| 12:15 PM 12/15 | 1.09 | 0.0787 |
| 12:00 PM 12/15 | 1.09 | 0.0787 |
| 11:45 AM 12/15 | 1.09 | 0.0787 |
| 11:30 AM 12/15 | 1.09 | 0.0787 |
| 11:15 AM 12/15 | 1.09 | 0.0787 |
| 11:00 AM 12/15 | 1.09 | 0.0787 |
| 10:45 AM 12/15 | 1.09 | 0.0787 |
| 10:30 AM 12/15 | 1.09 | 0.0787 |
| 10:15 AM 12/15 | 1.09 | 0.0787 |
34.06' -
this is the record flood level reached on September 26, 1993. Major Flooding affects roadways and property near the gage site and along the reach of the river.
33' -
major flooding affects roadways and property near the gage site and along the reach of the river.
30.9' -
flood waters rise to one foot above the bridge deck at the gage site. Approximate level of the one percent chance flood.
30' -
flood waters inundate low lying roadways near the river.
29.5' -
flood waters impact the bridge deck at the gage site.
27' -
the Highway 171 Bridge downstream from the gage site floods.
25.8' -
the gage is damaged by flood waters.
19' -
roads on the east side of Maple Bridge flood. Flood waters impact low areas near Galesburg upstream from the Waco forecast point. Blackberry Creek floods due to backwater effects from the Spring River.
16' -
flood waters begin to impact low areas along Maple Road and County Road 270 on the east side of the bridge where the gage is located.
| Date | Stage (ft) |
|---|---|
| Sep 26, 1993 | 34.06 |
| May 19, 1943 | 30.94 |
| Dec 28, 2015 | 30.82 |
| Jun 12, 2007 | 29.58 |
| Feb 24, 1985 | 28.8 |
| Oct 2, 1986 | 28.39 |
| Apr 30, 2017 | 28.14 |
| May 24, 2019 | 27.97 |
| May 6, 2022 | 27.68 |
| Apr 12, 1994 | 27.17 |
| Mar 20, 2008 | 27.09 |
| Apr 11, 2008 | 26.57 |
| Mar 11, 1974 | 26.29 |
| May 9, 1961 | 25.9 |
| Oct 10, 2009 | 25.84 |
| May 23, 2019 | 25.64 |
| Jul 4, 1976 | 25.42 |
| Nov 25, 1987 | 25.03 |
| Oct 6, 1998 | 24.91 |
| May 9, 2002 | 24.74 |
Data provided by the National Weather Service.