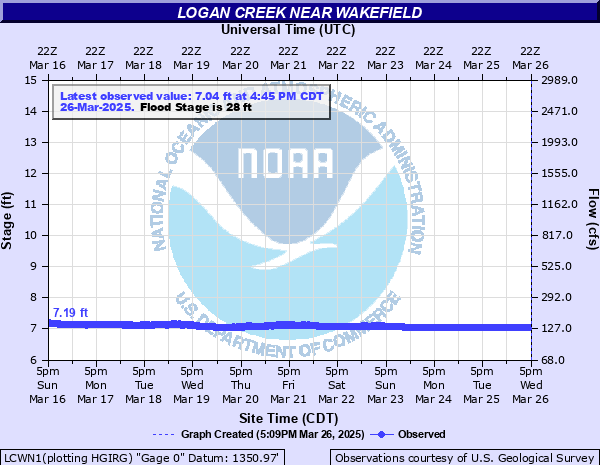
Logan Creek near Wakefield
Critical Stages
26' - Action
28' - Flood
32' - Moderate
37' - Major
Latest Observation
Updated: 3:45 PM CST 12/16/25
Status: No Flooding
Stage: 7.13 ft
Flow: 0.157 kcfs
Forecast
Forecast not available for this location.
| Time | Stage (ft) | Flow (kcfs) |
|---|---|---|
| 4:45 PM 12/16 | 7.13 | 0.157 |
| 4:40 PM 12/16 | 7.13 | 0.157 |
| 4:35 PM 12/16 | 7.14 | 0.159 |
| 4:30 PM 12/16 | 7.13 | 0.157 |
| 4:25 PM 12/16 | 7.13 | 0.157 |
| 4:20 PM 12/16 | 7.14 | 0.159 |
| 4:15 PM 12/16 | 7.13 | 0.157 |
| 4:10 PM 12/16 | 7.13 | 0.157 |
| 4:05 PM 12/16 | 7.13 | 0.157 |
| 4:00 PM 12/16 | 7.13 | 0.157 |
| 3:55 PM 12/16 | 7.13 | 0.157 |
| 3:50 PM 12/16 | 7.13 | 0.157 |
| 3:45 PM 12/16 | 7.13 | 0.157 |
| 3:40 PM 12/16 | 7.13 | 0.157 |
| 3:35 PM 12/16 | 7.13 | 0.157 |
| 3:30 PM 12/16 | 7.13 | 0.157 |
| 3:25 PM 12/16 | 7.13 | 0.157 |
| 3:20 PM 12/16 | 7.13 | 0.157 |
| 3:15 PM 12/16 | 7.12 | 0.156 |
| 3:10 PM 12/16 | 7.13 | 0.157 |
| 3:05 PM 12/16 | 7.12 | 0.156 |
| 3:00 PM 12/16 | 7.13 | 0.157 |
| 2:55 PM 12/16 | 7.13 | 0.157 |
| 2:50 PM 12/16 | 7.12 | 0.156 |
| 2:45 PM 12/16 | 7.12 | 0.156 |
| 2:40 PM 12/16 | 7.12 | 0.156 |
| 2:35 PM 12/16 | 7.12 | 0.156 |
| 2:30 PM 12/16 | 7.12 | 0.156 |
| 2:25 PM 12/16 | 7.12 | 0.156 |
| 2:20 PM 12/16 | 7.12 | 0.156 |
38' -
The levees on the south bank will begin to be overtopped resulting in siginificant flooding in the town of Wakefield.
37' -
The Hwy 35 bridge on the north side of Wakefield at the gauge location is overtopped.
34' -
Hwy 35 north of Wakefield begins to flood.
32' -
Several structures on the north side of Wakefield are in danger of flooding if the levee fails. Water reaches the low steel on the bridge at the gaging location.
29' -
The lowest portion of 859th east of Hwy 35 may begin to flood as do the lowest portions of 858th and 860th near the creek.
28' -
Crop land north and east of Wakefield is flooded.
26' -
The lowest right banks just downstream of the gauge begin to be overtopped.
21' -
The bike trail under the bridge at the gauge may begin to flood.
| Date | Stage (ft) |
|---|---|
| Mar 14, 2019 | 33.26 |
| Jun 26, 2018 | 30.5 |
| Jun 15, 2014 | 27.63 |
| Jun 12, 2010 | 26.1 |
| Apr 16, 2024 | 25.36 |
| Jun 7, 2015 | 22.38 |
| Mar 9, 2007 | 19.87 |
| Feb 10, 2009 | 18.6 |
| Jun 14, 2016 | 18.55 |
| Jun 10, 2003 | 17.14 |
| May 29, 2008 | 17.1 |
| May 17, 2017 | 16.99 |
| Jun 27, 2011 | 16.8 |
| May 26, 2012 | 15.95 |
| Feb 27, 2023 | 15.43 |
| Jun 11, 2004 | 12.6 |
| Feb 2, 2020 | 12.15 |
| Jun 21, 2005 | 11.92 |
| May 17, 2013 | 11.3 |
| Mar 31, 2006 | 10 |
Data provided by the National Weather Service.