« Back to North Bridgton Rivers
Pemigewasset River at Woodstock
Critical Stages
6' - Action
9' - Flood
13' - Moderate
16' - Major
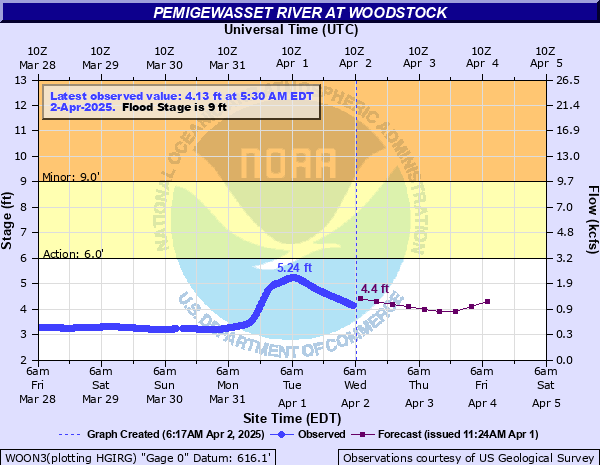
Latest Observation
Updated: 4:16 PM EST 12/5/25
Status: No Flooding
Stage: 2.63 ft
Flow: 0.198 kcfs
Forecast
| Time | Stage (ft) | Flow (kcfs) |
|---|---|---|
| 7 PM 12/5 | 2.6 | 0.189 |
| 1 AM 12/6 | 2.7 | 0.222 |
| 7 AM 12/6 | 2.8 | 0.259 |
| 1 PM 12/6 | 2.8 | 0.259 |
| 7 PM 12/6 | 2.7 | 0.222 |
| 1 AM 12/7 | 2.7 | 0.222 |
| 7 AM 12/7 | 2.7 | 0.222 |
| 1 PM 12/7 | 2.7 | 0.222 |
| 7 PM 12/7 | 2.7 | 0.222 |
| 1 AM 12/8 | 2.7 | 0.222 |
| 7 AM 12/8 | 2.7 | 0.222 |
| Time | Stage (ft) | Flow (kcfs) |
|---|---|---|
| 4:16 PM 12/5 | 2.63 | 0.198 |
| 3:30 PM 12/5 | 2.64 | 0.202 |
| 3:15 PM 12/5 | 2.64 | 0.202 |
| 3:00 PM 12/5 | 2.65 | 0.205 |
| 2:45 PM 12/5 | 2.66 | 0.208 |
| 2:30 PM 12/5 | 2.67 | 0.212 |
| 2:15 PM 12/5 | 2.69 | 0.219 |
| 2:00 PM 12/5 | 2.7 | 0.222 |
| 1:45 PM 12/5 | 2.72 | 0.229 |
| 1:30 PM 12/5 | 2.73 | 0.233 |
| 1:15 PM 12/5 | 2.73 | 0.233 |
| 1:00 PM 12/5 | 2.73 | 0.233 |
| 12:45 PM 12/5 | 2.73 | 0.233 |
| 12:30 PM 12/5 | 2.73 | 0.233 |
| 12:15 PM 12/5 | 2.72 | 0.229 |
| 12:00 PM 12/5 | 2.71 | 0.226 |
| 11:45 AM 12/5 | 2.67 | 0.212 |
| 11:30 AM 12/5 | 2.63 | 0.198 |
| 11:15 AM 12/5 | 2.6 | 0.189 |
| 11:00 AM 12/5 | 2.58 | 0.182 |
| 10:45 AM 12/5 | 2.57 | 0.179 |
| 10:30 AM 12/5 | 2.56 | 0.176 |
| 10:16 AM 12/5 | 2.53 | 0.167 |
| 10:15 AM 12/5 | 2.53 | 0.167 |
| 10:00 AM 12/5 | 2.52 | 0.164 |
| 9:45 AM 12/5 | 2.52 | 0.164 |
| 9:30 AM 12/5 | 2.52 | 0.164 |
| 9:15 AM 12/5 | 2.53 | 0.167 |
| 9:00 AM 12/5 | 2.55 | 0.173 |
| 8:45 AM 12/5 | 2.57 | 0.179 |
16.5' -
Significant flooding occurs along Route 112. Significant flooding also occurs along Route 3 and Route 175 from North Woodstock to West Campton. Some flooding occurs at the Riverfront condo development, the River Green Hotel and the Saint Andrews condos. Water rises up to the low steel on the Route 175 bridge in North Woodstock.
13' -
Route 175 floods to a depth of 2 to 4 feet from Cox Farm Road to Meadow Lane in Woodstock. Low lying areas along US route 3 also flood.
11' -
Route 175 floods to a depth of 1 foot at Cox Farm Road in Woodstock. Campgrounds along the river also flood.
9' -
Minor lowland flooding begins.
| Date | Stage (ft) |
|---|---|
| Aug 28, 2011 | 16.97 |
| Oct 24, 1959 | 16.13 |
| Dec 18, 2023 | 14.56 |
| Oct 22, 1995 | 14.09 |
| Apr 1, 1987 | 14.01 |
| Oct 30, 2017 | 13.54 |
| Jun 30, 1973 | 13.4 |
| Dec 21, 1973 | 12.64 |
| Apr 15, 2014 | 12.51 |
| Dec 21, 1957 | 12.43 |
| Apr 14, 2002 | 12.4 |
| Sep 17, 1999 | 12.18 |
| Dec 17, 2000 | 12.11 |
| Nov 26, 1950 | 12.05 |
| Apr 9, 2000 | 11.95 |
| Mar 27, 1953 | 11.65 |
| Apr 24, 2005 | 11.62 |
| Feb 3, 1973 | 11.41 |
| Sep 11, 1954 | 11.4 |
| Jun 1, 1952 | 11.19 |
Data provided by the National Weather Service.