« Back to North Carrollton Rivers
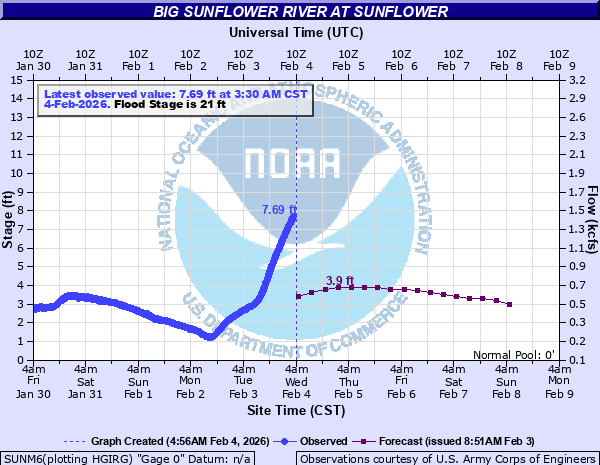
Big Sunflower River at Sunflower
Critical Stages
20' - Action
21' - Flood
25' - Moderate
28' - Major
Latest Observation
Updated: 1:30 PM CST 12/15/25
Status: No Flooding
Stage: -0.14 ft
Flow: -999 kcfs
Forecast
| Time | Stage (ft) | Flow (kcfs) |
|---|---|---|
| 6 PM 12/15 | -0.1 | -999 |
| 12 AM 12/16 | -0.2 | -999 |
| 6 AM 12/16 | -0.2 | -999 |
| 12 PM 12/16 | -0.3 | -999 |
| 6 PM 12/16 | -0.3 | -999 |
| 12 AM 12/17 | -0.4 | -999 |
| 6 AM 12/17 | -0.5 | -999 |
| 12 PM 12/17 | -0.5 | -999 |
| 6 PM 12/17 | -0.6 | -999 |
| 12 AM 12/18 | -0.7 | -999 |
| 6 AM 12/18 | -0.7 | -999 |
| 12 PM 12/18 | -0.8 | -999 |
| 6 PM 12/18 | -0.8 | -999 |
| 12 AM 12/19 | -0.9 | -999 |
| 6 AM 12/19 | -0.9 | -999 |
| 12 PM 12/19 | -0.9 | -999 |
| 6 PM 12/19 | -1 | -999 |
| 12 AM 12/20 | -1 | -999 |
| 6 AM 12/20 | -1.1 | -999 |
| Time | Stage (ft) | Flow (kcfs) |
|---|---|---|
| 1:30 PM 12/15 | -0.14 | -999 |
| 1:15 PM 12/15 | -0.15 | -999 |
| 1:00 PM 12/15 | -0.14 | -999 |
| 12:45 PM 12/15 | -0.14 | -999 |
| 12:30 PM 12/15 | -0.14 | -999 |
| 12:15 PM 12/15 | -0.13 | -999 |
| 12:00 PM 12/15 | -0.15 | -999 |
| 11:45 AM 12/15 | -0.13 | -999 |
| 11:30 AM 12/15 | -0.1 | -999 |
| 11:15 AM 12/15 | -0.09 | -999 |
| 11:00 AM 12/15 | -0.1 | -999 |
| 10:45 AM 12/15 | -0.08 | -999 |
| 10:30 AM 12/15 | -0.11 | -999 |
| 10:15 AM 12/15 | -0.12 | -999 |
| 10:00 AM 12/15 | -0.08 | -999 |
| 9:45 AM 12/15 | -0.11 | -999 |
| 9:30 AM 12/15 | -0.09 | -999 |
| 9:15 AM 12/15 | -0.1 | -999 |
| 9:00 AM 12/15 | -0.09 | -999 |
| 8:45 AM 12/15 | -0.1 | -999 |
| 8:30 AM 12/15 | -0.1 | -999 |
| 8:15 AM 12/15 | -0.05 | -999 |
| 8:00 AM 12/15 | -0.06 | -999 |
| 7:45 AM 12/15 | -0.05 | -999 |
| 7:30 AM 12/15 | -0.07 | -999 |
| 7:15 AM 12/15 | -0.06 | -999 |
| 7:00 AM 12/15 | -0.04 | -999 |
| 6:45 AM 12/15 | -0.04 | -999 |
| 6:30 AM 12/15 | -0.05 | -999 |
| 6:15 AM 12/15 | -0.04 | -999 |
28' -
Water is close to entering homes along the river. Significant acreage of farmland is flooded west of the river.
26' -
Low lying streets along the river in the city of Sunflower begin to flood. Moll Road, 3 miles northeast of Indianola, is impassable by car.
25' -
Water begins to cover a small section of Moll Road northeast of Indianola. Water begins to spread across farmland from Jones Bayou. Widespread agricultural flooding is a occurring in this area.
23' -
Farm roads to catfish ponds become inundated. Jeffcoat road west of river gage floods
21' -
Field west of river begins to flood.
| Date | Stage (ft) |
|---|---|
| Mar 18, 1973 | 28.37 |
| May 5, 1958 | 28.3 |
| May 2, 1991 | 28.1 |
| Jun 15, 2021 | 28.04 |
| Feb 24, 1991 | 28 |
| Mar 16, 2016 | 27.95 |
| Feb 26, 2019 | 27.83 |
| Dec 18, 2001 | 27.6 |
| Jan 1, 1983 | 27.6 |
| Dec 3, 2001 | 27.5 |
| Jan 15, 1946 | 27.4 |
| Feb 26, 2018 | 27.31 |
| Dec 6, 1983 | 27.3 |
| Feb 25, 1961 | 27.3 |
| Sep 26, 1958 | 27.3 |
| Nov 23, 1957 | 26.9 |
| Jul 7, 1989 | 26.9 |
| Jan 27, 1937 | 26.6 |
| Feb 16, 1948 | 26.6 |
| Apr 20, 1991 | 26.5 |
Data provided by the National Weather Service.