« Back to North Sandwich Rivers
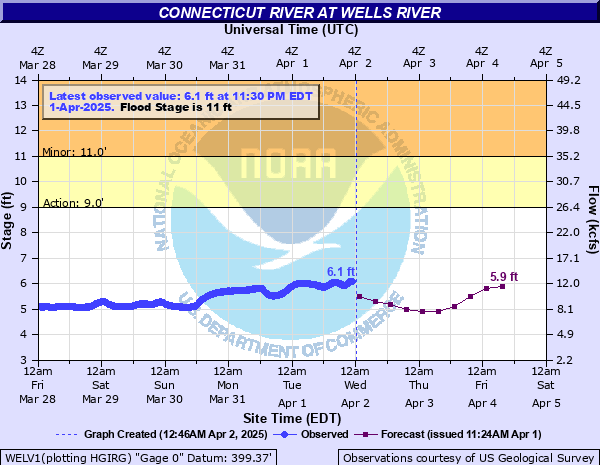
Connecticut River at Wells River
Critical Stages
9' - Action
11' - Flood
14' - Moderate
17' - Major
Latest Observation
Updated: 4:30 PM EST 12/5/25
Status: No Flooding
Stage: 2.32 ft
Flow: 1.29 kcfs
Forecast
| Time | Stage (ft) | Flow (kcfs) |
|---|---|---|
| 7 PM 12/5 | 2.4 | 1.38 |
| 1 AM 12/6 | 2.4 | 1.38 |
| 7 AM 12/6 | 2.4 | 1.38 |
| 1 PM 12/6 | 2.4 | 1.38 |
| 7 PM 12/6 | 2.4 | 1.38 |
| 1 AM 12/7 | 2.4 | 1.38 |
| 7 AM 12/7 | 2.4 | 1.38 |
| 1 PM 12/7 | 2.4 | 1.38 |
| 7 PM 12/7 | 2.4 | 1.38 |
| 1 AM 12/8 | 2.4 | 1.38 |
| 7 AM 12/8 | 2.4 | 1.38 |
| Time | Stage (ft) | Flow (kcfs) |
|---|---|---|
| 4:30 PM 12/5 | 2.32 | 1.29 |
| 4:15 PM 12/5 | 2.32 | 1.29 |
| 4:00 PM 12/5 | 2.33 | 1.3 |
| 3:45 PM 12/5 | 2.34 | 1.31 |
| 3:30 PM 12/5 | 2.34 | 1.31 |
| 3:15 PM 12/5 | 2.35 | 1.33 |
| 3:00 PM 12/5 | 2.34 | 1.31 |
| 2:45 PM 12/5 | 2.33 | 1.3 |
| 2:31 PM 12/5 | 2.32 | 1.29 |
| 2:30 PM 12/5 | 2.32 | 1.29 |
| 2:15 PM 12/5 | 2.31 | 1.28 |
| 2:00 PM 12/5 | 2.29 | 1.26 |
| 1:45 PM 12/5 | 2.28 | 1.25 |
| 1:30 PM 12/5 | 2.27 | 1.24 |
| 1:15 PM 12/5 | 2.26 | 1.23 |
| 1:00 PM 12/5 | 2.26 | 1.23 |
| 12:45 PM 12/5 | 2.26 | 1.23 |
| 12:30 PM 12/5 | 2.27 | 1.24 |
| 12:15 PM 12/5 | 2.28 | 1.25 |
| 12:00 PM 12/5 | 2.29 | 1.26 |
| 11:45 AM 12/5 | 2.31 | 1.28 |
| 11:30 AM 12/5 | 2.32 | 1.29 |
| 11:15 AM 12/5 | 2.33 | 1.3 |
| 11:00 AM 12/5 | 2.33 | 1.3 |
| 10:45 AM 12/5 | 2.33 | 1.3 |
| 10:30 AM 12/5 | 2.33 | 1.3 |
| 10:15 AM 12/5 | 2.33 | 1.3 |
| 10:00 AM 12/5 | 2.33 | 1.3 |
| 9:45 AM 12/5 | 2.34 | 1.31 |
| 9:30 AM 12/5 | 2.35 | 1.33 |
17' -
At 17.0 feet, water is 5 feet deep along a section of route 5 between Wells River and Fairlee Vermont.
15' -
Sections of Route 5 between Wells River and Fairlee are flooded with 1 to 3 feet of water in low sections of the road. In Woodsville, New Hampshire, water reaches homes with basement flooding along Connecticut Street and around the public pool. In Newbury, Vermont, Shaeffer Hill Road begins to flood. Thousands of acres of farmland are flooded.
14.3' -
Flooding begins along the public ball fields on Connecticut Street in Woodsville.
13' -
Hundreds of acres of farmland in New Hampshire and Vermont are flooded from Monroe to Fairlee.
12' -
Newbury Crossing Road floods.
11' -
Low lying farmland near the river begins to flood initially on the Vermont side.
| Date | Stage (ft) |
|---|---|
| Jul 1, 1973 | 17.35 |
| Mar 27, 1953 | 15.96 |
| May 31, 1984 | 15.03 |
| Apr 1, 1987 | 14.87 |
| Apr 24, 1954 | 14.67 |
| Apr 16, 2014 | 14.32 |
| May 6, 1972 | 14.24 |
| Apr 2, 1998 | 14.1 |
| Apr 2, 1976 | 13.91 |
| Apr 19, 1969 | 13.81 |
| Apr 24, 1958 | 13.72 |
| Jun 13, 2002 | 13.61 |
| Apr 29, 2011 | 13.58 |
| Dec 22, 1973 | 13.51 |
| Feb 12, 1981 | 13.47 |
| Apr 17, 1955 | 12.95 |
| Apr 21, 1950 | 12.62 |
| Apr 26, 2001 | 12.6 |
| Apr 25, 1992 | 12.5 |
| Apr 17, 1994 | 12.43 |
Data provided by the National Weather Service.