« Back to North Sandwich Rivers
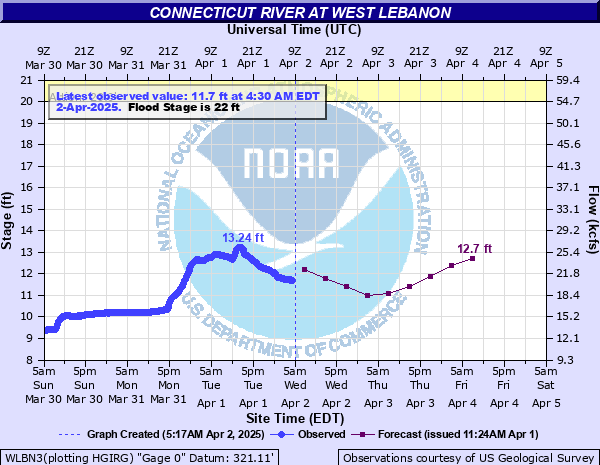
Connecticut River at West Lebanon
Critical Stages
20' - Action
22' - Flood
26' - Moderate
29' - Major
Latest Observation
Updated: 4:30 PM EST 12/5/25
Status: No Flooding
Stage: 4.18 ft
Flow: 1.3 kcfs
Forecast
| Time | Stage (ft) | Flow (kcfs) |
|---|---|---|
| 7 PM 12/5 | 5.2 | 2.72 |
| 1 AM 12/6 | 5.1 | 2.55 |
| 7 AM 12/6 | 5.1 | 2.55 |
| 1 PM 12/6 | 5.1 | 2.55 |
| 7 PM 12/6 | 5.1 | 2.55 |
| 1 AM 12/7 | 5.1 | 2.55 |
| 7 AM 12/7 | 5.1 | 2.55 |
| 1 PM 12/7 | 5.1 | 2.55 |
| 7 PM 12/7 | 5.1 | 2.55 |
| 1 AM 12/8 | 5.1 | 2.55 |
| 7 AM 12/8 | 5.1 | 2.55 |
| Time | Stage (ft) | Flow (kcfs) |
|---|---|---|
| 4:30 PM 12/5 | 4.18 | 1.3 |
| 4:15 PM 12/5 | 4.19 | 1.31 |
| 4:00 PM 12/5 | 4.2 | 1.32 |
| 3:45 PM 12/5 | 4.21 | 1.33 |
| 3:30 PM 12/5 | 4.22 | 1.34 |
| 3:15 PM 12/5 | 4.24 | 1.36 |
| 3:00 PM 12/5 | 4.25 | 1.37 |
| 2:45 PM 12/5 | 4.26 | 1.38 |
| 2:30 PM 12/5 | 4.28 | 1.41 |
| 2:15 PM 12/5 | 4.3 | 1.43 |
| 2:00 PM 12/5 | 4.33 | 1.46 |
| 1:45 PM 12/5 | 4.37 | 1.51 |
| 1:30 PM 12/5 | 4.42 | 1.57 |
| 1:15 PM 12/5 | 4.49 | 1.65 |
| 1:00 PM 12/5 | 4.59 | 1.78 |
| 12:45 PM 12/5 | 4.72 | 1.96 |
| 12:30 PM 12/5 | 4.88 | 2.2 |
| 12:15 PM 12/5 | 5.08 | 2.52 |
| 12:00 PM 12/5 | 5.33 | 2.95 |
| 11:45 AM 12/5 | 5.25 | 2.81 |
| 11:30 AM 12/5 | 5.25 | 2.81 |
| 11:15 AM 12/5 | 5.24 | 2.79 |
| 11:00 AM 12/5 | 5.24 | 2.79 |
| 10:45 AM 12/5 | 5.25 | 2.81 |
| 10:30 AM 12/5 | 5.25 | 2.81 |
| 10:15 AM 12/5 | 5.25 | 2.81 |
| 10:00 AM 12/5 | 5.25 | 2.81 |
| 9:45 AM 12/5 | 5.26 | 2.83 |
| 9:30 AM 12/5 | 5.26 | 2.83 |
| 9:15 AM 12/5 | 5.26 | 2.83 |
30' -
In White River Junction, Vermont, flooding occurs at Ratcliffe Park, Nutt Lane, and Harrison Avenue. Portions of Latham Works Lane are flooded.
29' -
In West Lebanon, North Country Plaza is flooded. Stores in Upper Valley Plaza have up to 5 ft of water. Romano Circle Apartments are flooded. Route 12A is flooded with 1 to 3 feet of water.
27' -
Route 12A and Romano Circle in West Lebanon start to flood.
25' -
Water starts to enter the stores closest to the river in Upper Valley Plaza in West Lebanon, New Hampshire. In White River Junction, Vermont, water starts to enter Ratcliffe Park.
22' -
Water starts entering the parking lot of the shopping plaza in West Lebanon just north of Interstate 89 along Main Street in Lebanon.
| Date | Stage (ft) |
|---|---|
| Nov 4, 1927 | 35 |
| Mar 19, 1936 | 32.6 |
| Mar 27, 1913 | 30 |
| Aug 29, 2011 | 29.66 |
| Apr 12, 1922 | 27 |
| Sep 22, 1938 | 26.7 |
| Jun 30, 1973 | 25.3 |
| Mar 6, 1964 | 24.77 |
| Mar 27, 1953 | 24.48 |
| Apr 19, 1933 | 24.2 |
| Feb 12, 1981 | 23.9 |
| Apr 2, 1976 | 23.5 |
| Feb 12, 1970 | 23.33 |
| Jan 22, 1959 | 23.08 |
| Apr 1, 1987 | 23.06 |
| Apr 8, 1912 | 23 |
| Jul 11, 2023 | 22.93 |
| Apr 21, 1914 | 22.8 |
| Mar 29, 1925 | 22.8 |
| May 31, 1984 | 22.59 |
Data provided by the National Weather Service.