« Back to North Sandwich Rivers
Wells River at Wells River
Critical Stages
5' - Action
6' - Flood
8' - Moderate
9' - Major
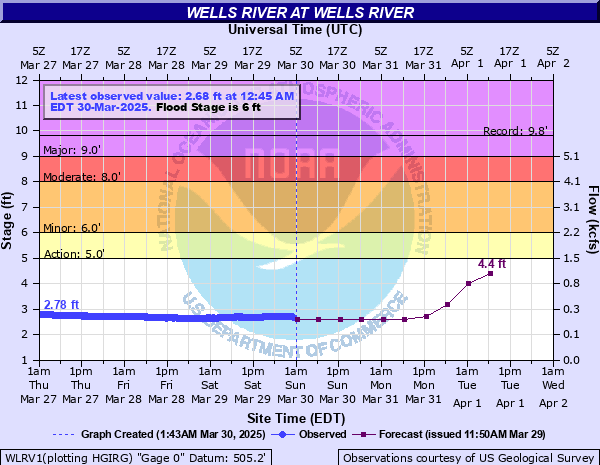
Latest Observation
Updated: 4:45 PM EST 12/5/25
Status: No Flooding
Stage: 1.94 ft
Flow: 0.0643 kcfs
Forecast
Forecast not available for this location.
| Time | Stage (ft) | Flow (kcfs) |
|---|---|---|
| 4:45 PM 12/5 | 1.94 | 0.0643 |
| 4:30 PM 12/5 | 1.94 | 0.0643 |
| 4:15 PM 12/5 | 1.93 | 0.063 |
| 4:00 PM 12/5 | 1.93 | 0.063 |
| 3:45 PM 12/5 | 1.92 | 0.0616 |
| 3:30 PM 12/5 | 1.92 | 0.0616 |
| 3:15 PM 12/5 | 1.91 | 0.0603 |
| 3:00 PM 12/5 | 1.9 | 0.059 |
| 2:45 PM 12/5 | 1.9 | 0.059 |
| 2:30 PM 12/5 | 1.89 | 0.0577 |
| 2:15 PM 12/5 | 1.89 | 0.0577 |
| 2:00 PM 12/5 | 1.88 | 0.0564 |
| 1:45 PM 12/5 | 1.87 | 0.0552 |
| 1:30 PM 12/5 | 1.87 | 0.0552 |
| 1:15 PM 12/5 | 1.87 | 0.0552 |
| 1:00 PM 12/5 | 1.86 | 0.0539 |
| 12:45 PM 12/5 | 1.85 | 0.0527 |
| 12:30 PM 12/5 | 1.85 | 0.0527 |
| 12:15 PM 12/5 | 1.83 | 0.0504 |
| 12:00 PM 12/5 | 1.83 | 0.0504 |
| 11:45 AM 12/5 | 1.82 | 0.0492 |
| 11:30 AM 12/5 | 1.81 | 0.0481 |
| 11:15 AM 12/5 | 1.8 | 0.047 |
| 11:00 AM 12/5 | 1.8 | 0.047 |
| 10:45 AM 12/5 | 1.8 | 0.047 |
| 10:30 AM 12/5 | 1.79 | 0.046 |
| 10:15 AM 12/5 | 1.79 | 0.046 |
| 10:00 AM 12/5 | 1.78 | 0.0451 |
| 9:45 AM 12/5 | 1.78 | 0.0451 |
| 9:30 AM 12/5 | 1.77 | 0.0442 |
9' -
The villages of Wells River, South Ryegate, and Groton become isolated due to flooded roadways. Water reaches a depth of about 2 feet in downtown Wells River. Low lying buildings and roads along the Wells River in Groton, South Ryegate, and Wells River take on water, with significant flooding along route 302. Flooding is similar to Irene in 2011.
8.5' -
Flooding occurs in the town of Wells River beginning at the fire station at the intersection of Routes 302 and 5 and continuing down Route 5 until the Happy Hour restaurant. Buildings on the east side of Route 5 flood. Low lying roads and buildings along the Wells River may take on water in Groton and South Ryegate.
6' -
Water approaches US Highway 302 along the Wells River in Groton, South Ryegate, and Wells River.
| Date | Stage (ft) |
|---|---|
| Jun 30, 1973 | 9.82 |
| Aug 29, 2011 | 9 |
| Jun 7, 1984 | 8.68 |
| Jul 15, 1997 | 8.54 |
| Jul 11, 2024 | 8.18 |
| Jun 2, 1952 | 8.12 |
| Jul 2, 2017 | 7.61 |
| Jul 11, 2023 | 7.54 |
| Apr 16, 2014 | 7.54 |
| Jan 20, 1996 | 7.52 |
| May 27, 2011 | 7.39 |
| Dec 19, 2023 | 7.33 |
| Oct 28, 1981 | 7.32 |
| Apr 15, 2019 | 7.21 |
| Apr 1, 1976 | 7.12 |
| May 5, 1972 | 7.03 |
| Dec 18, 2000 | 6.87 |
| Apr 1, 1987 | 6.83 |
| Dec 21, 1973 | 6.82 |
| Oct 1, 2010 | 6.71 |
Data provided by the National Weather Service.