« Back to Northeast Vashon Park Rivers
Cedar River (WA) near Landsburg
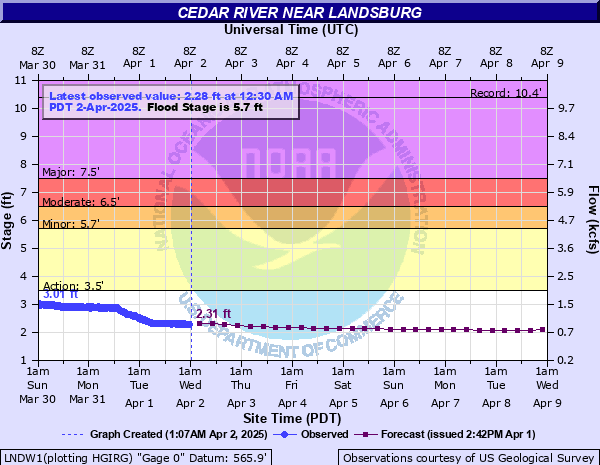
Critical Stages
3.5' - Action
5.7' - Flood
6.5' - Moderate
7.5' - Major
Latest Observation
Updated: 4:15 AM PST 12/6/25
Status: No Flooding
Stage: 1.82 ft
Flow: 0.601 kcfs
Forecast
| Time | Stage (ft) | Flow (kcfs) |
|---|---|---|
| 10 AM 12/6 | 1.73 | 0.549 |
| 4 PM 12/6 | 1.72 | 0.544 |
| 10 PM 12/6 | 1.72 | 0.544 |
| 4 AM 12/7 | 1.72 | 0.544 |
| 10 AM 12/7 | 1.74 | 0.555 |
| 4 PM 12/7 | 1.81 | 0.595 |
| 10 PM 12/7 | 1.85 | 0.619 |
| 4 AM 12/8 | 1.85 | 0.619 |
| 10 AM 12/8 | 1.89 | 0.644 |
| 4 PM 12/8 | 2.03 | 0.732 |
| 10 PM 12/8 | 2.23 | 0.869 |
| 4 AM 12/9 | 2.39 | 0.986 |
| 10 AM 12/9 | 2.47 | 1.05 |
| 4 PM 12/9 | 2.51 | 1.08 |
| 10 PM 12/9 | 2.55 | 1.11 |
| 4 AM 12/10 | 2.61 | 1.16 |
| 10 AM 12/10 | 3.23 | 1.73 |
| 4 PM 12/10 | 3.51 | 2.01 |
| 10 PM 12/10 | 3.65 | 2.15 |
| 4 AM 12/11 | 3.78 | 2.28 |
| 10 AM 12/11 | 3.96 | 2.47 |
| 4 PM 12/11 | 4.13 | 2.65 |
| 10 PM 12/11 | 4.29 | 2.82 |
| 4 AM 12/12 | 4.43 | 2.97 |
| 10 AM 12/12 | 4.55 | 3.1 |
| 4 PM 12/12 | 4.66 | 3.22 |
| 10 PM 12/12 | 4.78 | 3.35 |
| 4 AM 12/13 | 4.9 | 3.48 |
| 10 AM 12/13 | 4.79 | 3.36 |
| 4 PM 12/13 | 4.67 | 3.23 |
| 10 PM 12/13 | 4.54 | 3.09 |
| 4 AM 12/14 | 4.42 | 2.96 |
| 10 AM 12/14 | 4.37 | 2.9 |
| 4 PM 12/14 | 4.33 | 2.86 |
| 10 PM 12/14 | 4.29 | 2.82 |
| 4 AM 12/15 | 4.27 | 2.8 |
| Time | Stage (ft) | Flow (kcfs) |
|---|---|---|
| 4:30 AM 12/6 | 1.82 | 0.601 |
| 4:15 AM 12/6 | 1.82 | 0.601 |
| 4:00 AM 12/6 | 1.81 | 0.595 |
| 3:45 AM 12/6 | 1.81 | 0.595 |
| 3:30 AM 12/6 | 1.81 | 0.595 |
| 3:15 AM 12/6 | 1.81 | 0.595 |
| 3:00 AM 12/6 | 1.81 | 0.595 |
| 2:45 AM 12/6 | 1.81 | 0.595 |
| 2:30 AM 12/6 | 1.8 | 0.59 |
| 2:15 AM 12/6 | 1.8 | 0.59 |
| 2:00 AM 12/6 | 1.8 | 0.59 |
| 1:45 AM 12/6 | 1.79 | 0.584 |
| 1:30 AM 12/6 | 1.78 | 0.578 |
| 1:15 AM 12/6 | 1.77 | 0.572 |
| 1:00 AM 12/6 | 1.78 | 0.578 |
| 12:45 AM 12/6 | 1.78 | 0.578 |
| 12:30 AM 12/6 | 1.77 | 0.572 |
| 12:15 AM 12/6 | 1.76 | 0.566 |
| 12:00 AM 12/6 | 1.75 | 0.561 |
| 11:45 PM 12/5 | 1.75 | 0.561 |
| 11:30 PM 12/5 | 1.74 | 0.555 |
| 11:15 PM 12/5 | 1.74 | 0.555 |
| 11:00 PM 12/5 | 1.74 | 0.555 |
| 10:45 PM 12/5 | 1.74 | 0.555 |
| 10:30 PM 12/5 | 1.74 | 0.555 |
| 10:15 PM 12/5 | 1.74 | 0.555 |
| 10:00 PM 12/5 | 1.74 | 0.555 |
| 9:45 PM 12/5 | 1.73 | 0.549 |
| 9:30 PM 12/5 | 1.73 | 0.549 |
| 9:15 PM 12/5 | 1.73 | 0.549 |
7.5' -
the Cedar River will cause severe flooding from Landsburg downstream through Maplewood. Deep and swift flood waters will inundate many roads and some residential areas, especially in Maple Valley. Flooding will occur all along the river including headwaters, tributaries, and other streams within and near the Cedar River Basin. A stage of 7.5 feet on the Cedar River corresponds to a phase 4 flood in the King County flood system.
6.5' -
the Cedar River will cause major flooding from Landsburg downstream through Maplewood. Deep and swift flood waters will inundate many roads and some residential areas, especially in Maple Valley. Flooding threatens SR-169. Flooding will occur all along the river including headwaters, tributaries, and other streams within and near the Cedar River Basin. A stage of 6.5 feet on the Cedar River corresponds to a phase 4 flood in the King County flood system.
5.7' -
the Cedar River will cause flooding from Landsburg downstream through Maplewood. Swift waters will flood roads and some residential areas, especially in Maple Valley. Flooding threatens Beyers Road. A stage of 5.7 feet on the Cedar River corresponds roughly to a phase 4 flood in the King County flood system.
5' -
the Cedar River will flood low areas from Landsburg downstream through Maplewood, mainly in Dorre Don area of Maple Valley and along Jones Rd. A stage of 5.0 feet on the Cedar River corresponds roughly to a phase 3 flood in the King County flood system.
4.4' -
the Cedar River will locally spill over its banks and over Jones Rd near 156th Ave SE. A stage of 4.4 feet on the Cedar River corresponds roughly to Phase 2 in the King County flood system.
| Date | Stage (ft) |
|---|---|
| Dec 29, 1917 | 13.55 |
| Jan 13, 1928 | 10.95 |
| Nov 24, 1990 | 10.38 |
| Jan 10, 1923 | 10.3 |
| Mar 10, 1916 | 9.74 |
| Jan 22, 1919 | 9.6 |
| Feb 12, 1924 | 9.2 |
| Feb 8, 1925 | 8.83 |
| Dec 4, 1975 | 8.49 |
| Jan 8, 2009 | 8.44 |
| Feb 8, 2020 | 8.23 |
| Dec 22, 1933 | 7.7 |
| Nov 30, 1995 | 7.43 |
| Feb 11, 1951 | 6.94 |
| Dec 3, 1977 | 6.94 |
| Feb 9, 1996 | 6.78 |
| Nov 7, 2006 | 6.03 |
| Nov 24, 1959 | 6 |
| Jan 17, 2011 | 5.97 |
| Feb 26, 1932 | 5.9 |
Data provided by the National Weather Service.