« Back to Northeast Vashon Park Rivers
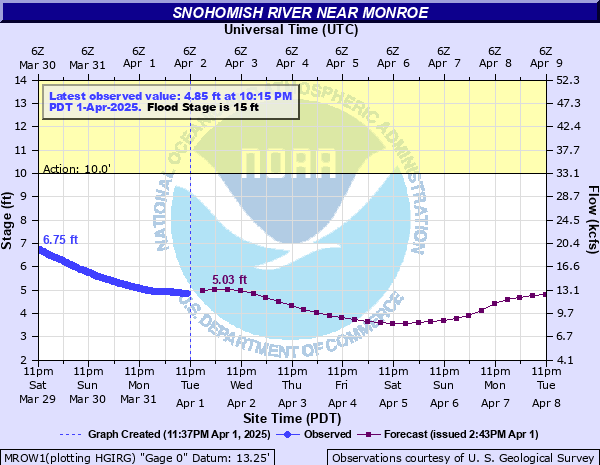
Snohomish River near Monroe
Critical Stages
10' - Action
15' - Flood
16' - Moderate
17' - Major
Latest Observation
Updated: 4:15 AM PST 12/6/25
Status: No Flooding
Stage: 5 ft
Flow: 13.1 kcfs
Forecast
| Time | Stage (ft) | Flow (kcfs) |
|---|---|---|
| 10 AM 12/6 | 5.65 | 15.4 |
| 4 PM 12/6 | 6.13 | 17.1 |
| 10 PM 12/6 | 6.03 | 16.7 |
| 4 AM 12/7 | 5.92 | 16.3 |
| 10 AM 12/7 | 5.71 | 15.6 |
| 4 PM 12/7 | 5.86 | 16.1 |
| 10 PM 12/7 | 6.49 | 18.5 |
| 4 AM 12/8 | 6.72 | 19.3 |
| 10 AM 12/8 | 7.43 | 22.1 |
| 4 PM 12/8 | 9.64 | 31.5 |
| 10 PM 12/8 | 12.27 | 43.7 |
| 4 AM 12/9 | 14.55 | 55.2 |
| 10 AM 12/9 | 16.2 | 63.9 |
| 4 PM 12/9 | 16.73 | 66.8 |
| 10 PM 12/9 | 16.26 | 64.3 |
| 4 AM 12/10 | 15.87 | 62.2 |
| 10 AM 12/10 | 15.59 | 60.7 |
| 4 PM 12/10 | 16.14 | 63.6 |
| 10 PM 12/10 | 17 | 68.3 |
| 4 AM 12/11 | 17.24 | 69.6 |
| 10 AM 12/11 | 16.59 | 66.1 |
| 4 PM 12/11 | 15.45 | 59.9 |
| 10 PM 12/11 | 14.81 | 56.5 |
| 4 AM 12/12 | 14.55 | 55.2 |
| 10 AM 12/12 | 14.13 | 53 |
| 4 PM 12/12 | 13.71 | 50.9 |
| 10 PM 12/12 | 13.28 | 48.7 |
| 4 AM 12/13 | 12.84 | 46.5 |
| 10 AM 12/13 | 12.17 | 43.2 |
| 4 PM 12/13 | 11.48 | 39.9 |
| 10 PM 12/13 | 11.23 | 38.7 |
| 4 AM 12/14 | 10.86 | 37 |
| 10 AM 12/14 | 10.09 | 33.5 |
| 4 PM 12/14 | 9.29 | 29.9 |
| 10 PM 12/14 | 8.58 | 26.9 |
| 4 AM 12/15 | 8.05 | 24.7 |
| Time | Stage (ft) | Flow (kcfs) |
|---|---|---|
| 4:15 AM 12/6 | 5 | 13.1 |
| 4:00 AM 12/6 | 4.95 | 12.9 |
| 3:45 AM 12/6 | 4.91 | 12.7 |
| 3:30 AM 12/6 | 4.87 | 12.6 |
| 3:15 AM 12/6 | 4.84 | 12.5 |
| 3:00 AM 12/6 | 4.79 | 12.3 |
| 2:45 AM 12/6 | 4.75 | 12.2 |
| 2:30 AM 12/6 | 4.71 | 12.1 |
| 2:15 AM 12/6 | 4.66 | 11.9 |
| 2:00 AM 12/6 | 4.61 | 11.7 |
| 1:45 AM 12/6 | 4.56 | 11.6 |
| 1:30 AM 12/6 | 4.51 | 11.4 |
| 1:15 AM 12/6 | 4.44 | 11.2 |
| 1:00 AM 12/6 | 4.37 | 10.9 |
| 12:45 AM 12/6 | 4.29 | 10.7 |
| 12:30 AM 12/6 | 4.21 | 10.4 |
| 12:15 AM 12/6 | 4.11 | 10.1 |
| 12:00 AM 12/6 | 4.02 | 9.81 |
| 11:45 PM 12/5 | 3.93 | 9.52 |
| 11:30 PM 12/5 | 3.84 | 9.24 |
| 11:15 PM 12/5 | 3.76 | 8.99 |
| 11:00 PM 12/5 | 3.71 | 8.84 |
| 10:45 PM 12/5 | 3.65 | 8.65 |
| 10:30 PM 12/5 | 3.6 | 8.5 |
| 10:15 PM 12/5 | 3.56 | 8.38 |
| 10:00 PM 12/5 | 3.52 | 8.26 |
| 9:45 PM 12/5 | 3.48 | 8.14 |
| 9:30 PM 12/5 | 3.45 | 8.05 |
| 9:15 PM 12/5 | 3.43 | 7.99 |
| 9:00 PM 12/5 | 3.41 | 7.93 |
22' -
the Snohomish River will cause severe flooding...with deep and swift flood waters inundating farm land...residential areas...and roads. Levees could suffer overtopping and major damage. Flooding will occur all along the river including headwaters...tributaries...and other streams within and near the Snohomish River Basin. A stage of 22 feet at this location corresponds to Phase 4 in the Snohomish County Flood Warning System.
21' -
Flooding will occur all along the river including headwaters...tributaries...and other streams within and near the Snohomish River Basin. The Snohomish River stage at this location corresponds to Phase 4 in the Snohomish County Flood Warning System.
20' -
the Snohomish River will cause severe flooding in the valley. The river will flood many homes...cover much of the farmlands...and close many roads. Flooding will occur all along the river including headwaters...tributaries...and other streams within and near the Snohomish River Basin. A stage of 20 feet at this location corresponds to Phase 3 in the Snohomish County Flood Warning System.
17' -
the Snohomish River will cause major flooding...inundating farm land...roads...and some residential areas. Levees will likely suffer damage. Flooding will occur all along the river including headwaters...tributaries...and other streams within and near the Snohomish River Basin. A stage of 17 feet at this location corresponds to Phase 2 in the Snohomish County Flood Warning System.
16' -
the Snohomish River will flood several roads and much of the low pasture land in the river valley. A stage of 16 feet at this location corresponds to Phase 2 in the Snohomish County Flood Warning System.
15' -
the Snohomish River will cause minor flooding of low pasture lands and several roads near the river. A stage of 15 feet at this location corresponds to Phase 2 in the Snohomish County Flood Warning System.
14' -
feet...the Snohomish River will locally spill over its banks into low pasture lands along the river.
| Date | Stage (ft) |
|---|---|
| Nov 25, 1990 | 25.3 |
| Jan 8, 2009 | 24.12 |
| Nov 30, 1995 | 24.1 |
| Nov 7, 2006 | 23.54 |
| Dec 4, 1975 | 22.92 |
| Nov 10, 1990 | 21.65 |
| Feb 9, 1996 | 21.53 |
| Nov 24, 1986 | 20.68 |
| Dec 3, 1977 | 19.74 |
| Dec 26, 1980 | 19.6 |
| Jan 17, 2011 | 19.24 |
| Nov 9, 1995 | 18.72 |
| Nov 18, 2015 | 18.7 |
| Dec 18, 1979 | 18.48 |
| Feb 2, 2020 | 18.41 |
| Feb 16, 1982 | 18 |
| Nov 13, 2008 | 17.89 |
| Dec 5, 1989 | 17.68 |
| Dec 26, 1967 | 17.68 |
| Jan 17, 1974 | 17.59 |
Data provided by the National Weather Service.