« Back to Northeast Vashon Park Rivers
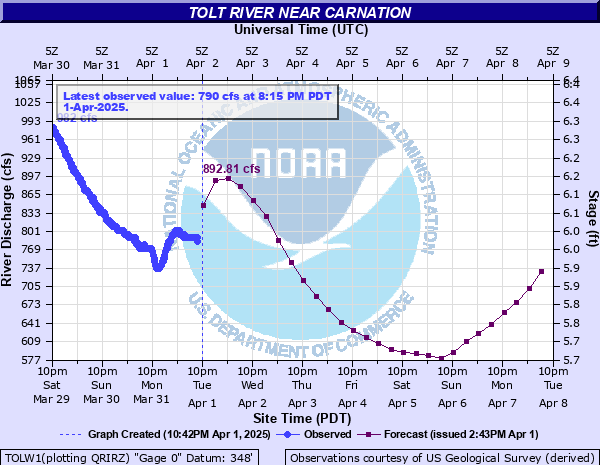
Tolt River near Carnation
Critical Stages
Action
Flood
Moderate
Major
Latest Observation
Updated: 3:15 AM PST 12/6/25
Status: No Flooding
Stage: 0.749 ft
Flow: 6 kcfs
Forecast
| Time | Stage (ft) | Flow (kcfs) |
|---|---|---|
| 10 AM 12/6 | 0.84417 | 6.1 |
| 4 PM 12/6 | 0.82941 | 6.1 |
| 10 PM 12/6 | 0.80834 | 6.1 |
| 4 AM 12/7 | 0.77079 | 6 |
| 10 AM 12/7 | 0.79978 | 6.1 |
| 4 PM 12/7 | 1.13006 | 6.5 |
| 10 PM 12/7 | 1.19764 | 6.6 |
| 4 AM 12/8 | 1.1449 | 6.5 |
| 10 AM 12/8 | 1.71556 | 7.2 |
| 4 PM 12/8 | 4.2792 | 9 |
| 10 PM 12/8 | 6.60611 | 10.2 |
| 4 AM 12/9 | 7.09398 | 10.4 |
| 10 AM 12/9 | 6.44625 | 10.1 |
| 4 PM 12/9 | 5.23935 | 9.6 |
| 10 PM 12/9 | 5.22283 | 9.5 |
| 4 AM 12/10 | 5.70474 | 9.8 |
| 10 AM 12/10 | 6.4081 | 10.1 |
| 4 PM 12/10 | 6.16939 | 10 |
| 10 PM 12/10 | 5.96757 | 9.9 |
| 4 AM 12/11 | 5.63864 | 9.8 |
| 10 AM 12/11 | 5.46471 | 9.7 |
| 4 PM 12/11 | 5.02829 | 9.5 |
| 10 PM 12/11 | 4.43688 | 9.1 |
| 4 AM 12/12 | 3.82725 | 8.8 |
| 10 AM 12/12 | 2.69964 | 8 |
| 4 PM 12/12 | 2.55365 | 7.9 |
| 10 PM 12/12 | 3.02848 | 8.3 |
| 4 AM 12/13 | 2.59557 | 7.9 |
| 10 AM 12/13 | 1.88807 | 7.3 |
| 4 PM 12/13 | 1.49768 | 7 |
| 10 PM 12/13 | 1.2866 | 6.7 |
| 4 AM 12/14 | 1.17404 | 6.6 |
| 10 AM 12/14 | 1.09747 | 6.5 |
| 4 PM 12/14 | 1.04404 | 6.4 |
| 10 PM 12/14 | 1.01576 | 6.4 |
| 4 AM 12/15 | 1.05047 | 6.4 |
| Time | Stage (ft) | Flow (kcfs) |
|---|---|---|
| 3:15 AM 12/6 | 0.749 | 6 |
| 3:00 AM 12/6 | 0.756 | 6 |
| 2:45 AM 12/6 | 0.762 | 6 |
| 2:30 AM 12/6 | 0.769 | 6 |
| 2:15 AM 12/6 | 0.775 | 6 |
| 2:00 AM 12/6 | 0.775 | 6 |
| 1:45 AM 12/6 | 0.789 | 6 |
| 1:30 AM 12/6 | 0.795 | 6.1 |
| 1:15 AM 12/6 | 0.802 | 6.1 |
| 1:00 AM 12/6 | 0.809 | 6.1 |
| 12:45 AM 12/6 | 0.816 | 6.1 |
| 12:30 AM 12/6 | 0.823 | 6.1 |
| 12:15 AM 12/6 | 0.837 | 6.1 |
| 12:00 AM 12/6 | 0.844 | 6.1 |
| 11:45 PM 12/5 | 0.851 | 6.1 |
| 11:30 PM 12/5 | 0.858 | 6.1 |
| 11:15 PM 12/5 | 0.872 | 6.2 |
| 11:00 PM 12/5 | 0.879 | 6.2 |
| 10:45 PM 12/5 | 0.886 | 6.2 |
| 10:30 PM 12/5 | 0.901 | 6.2 |
| 10:15 PM 12/5 | 0.916 | 6.2 |
| 10:00 PM 12/5 | 0.923 | 6.2 |
| 9:45 PM 12/5 | 0.938 | 6.3 |
| 9:30 PM 12/5 | 0.946 | 6.3 |
| 9:15 PM 12/5 | 0.961 | 6.3 |
| 9:00 PM 12/5 | 0.968 | 6.3 |
| 8:45 PM 12/5 | 0.982 | 6.3 |
| 8:30 PM 12/5 | 0.997 | 6.3 |
| 8:15 PM 12/5 | 1 | 6.3 |
| 8:00 PM 12/5 | 1.01 | 6.4 |
10500' -
the Tolt River will cause severe flooding. Dangerously deep and quick flood waters will cover roads and driveways...with some homes flooded. The river will likely overtop some levees. Erosion could cause serious damage and channel changes may occur. Flooding will occur all along the river including headwaters...tributaries...and other streams within and near the Tolt River Basin. This river level on the Tolt corresponds to a phase 4 flood in the King County flood system.
8500' -
the Tolt River will cause major flooding. Deep and quick flood waters will cover roads and driveways...cutting off access to many homes. Levees may overtop and channel changes may occur. Flooding will occur all along the river including headwaters...tributaries...and other streams within and near the Tolt River Basin. This river level on the Tolt corresponds to a phase 4 flood in the King County flood system.
5000' -
the Tolt River will flood Tolt River Rd NE and many driveways. Some homes in the San Souci area could be inaccessible due to deep and quick flood waters. This river level on the Tolt corresponds to a phase 3 flood in the King County flood system.
3500' -
the Tolt River will spill over its banks with water over 353rd Ave NE and some driveways in the San Souci area. This river level on the Tolt corresponds to a phase 2 flood in the King County flood system.
| Date | Stage (ft) |
|---|---|
| Dec 15, 1959 | 13.04 |
| Feb 9, 1951 | 12.92 |
| Jan 8, 2009 | 12.59 |
| Dec 11, 1955 | 12.52 |
| Jan 7, 1945 | 12.14 |
| Oct 31, 1942 | 11.95 |
| Nov 24, 1990 | 11.62 |
| Mar 4, 1950 | 11.54 |
| Apr 18, 1938 | 11.51 |
| Jan 5, 1969 | 11.34 |
| Nov 19, 1962 | 11.3 |
| Feb 1, 2020 | 11.3 |
| Nov 12, 2008 | 11.29 |
| Dec 15, 1999 | 11.28 |
| Dec 2, 1943 | 11.24 |
| Nov 29, 1995 | 11.19 |
| Jan 23, 1953 | 11.19 |
| Jan 5, 2015 | 11.16 |
| Dec 9, 1953 | 11.15 |
| Oct 20, 2003 | 11.11 |
Data provided by the National Weather Service.