« Back to Northern Lights Rivers
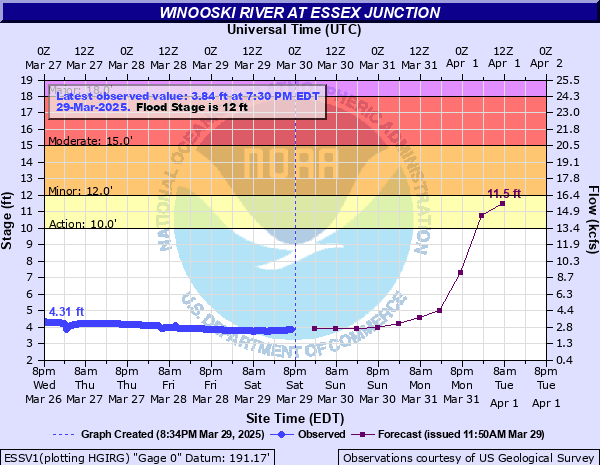
Winooski River at Essex Junction
Critical Stages
10' - Action
12' - Flood
15' - Moderate
18' - Major
Latest Observation
Updated: 1:30 AM EST 12/15/25
Status: No Flooding
Stage: 2.51 ft
Flow: 0.768 kcfs
Forecast
| Time | Stage (ft) | Flow (kcfs) |
|---|---|---|
| 7 AM 12/15 | 2.4 | 0.679 |
| 1 PM 12/15 | 2.4 | 0.679 |
| 7 PM 12/15 | 2.4 | 0.679 |
| 1 AM 12/16 | 2.4 | 0.679 |
| 7 AM 12/16 | 2.4 | 0.679 |
| 1 PM 12/16 | 2.4 | 0.679 |
| 7 PM 12/16 | 2.4 | 0.679 |
| 1 AM 12/17 | 2.4 | 0.679 |
| 7 AM 12/17 | 2.3 | 0.604 |
| Time | Stage (ft) | Flow (kcfs) |
|---|---|---|
| 2:30 AM 12/15 | 2.55 | 0.802 |
| 2:15 AM 12/15 | 2.54 | 0.794 |
| 2:00 AM 12/15 | 2.54 | 0.794 |
| 1:45 AM 12/15 | 2.53 | 0.785 |
| 1:30 AM 12/15 | 2.51 | 0.768 |
| 1:15 AM 12/15 | 2.51 | 0.768 |
| 1:00 AM 12/15 | 2.51 | 0.768 |
| 12:45 AM 12/15 | 2.5 | 0.76 |
| 12:30 AM 12/15 | 2.5 | 0.76 |
| 12:15 AM 12/15 | 2.5 | 0.76 |
| 12:00 AM 12/15 | 2.5 | 0.76 |
| 11:45 PM 12/14 | 2.5 | 0.76 |
| 11:30 PM 12/14 | 2.5 | 0.76 |
| 11:15 PM 12/14 | 2.5 | 0.76 |
| 11:00 PM 12/14 | 2.51 | 0.768 |
| 10:45 PM 12/14 | 2.52 | 0.777 |
| 10:30 PM 12/14 | 2.52 | 0.777 |
| 10:15 PM 12/14 | 2.52 | 0.777 |
| 10:00 PM 12/14 | 2.53 | 0.785 |
| 9:45 PM 12/14 | 2.53 | 0.785 |
| 9:30 PM 12/14 | 2.53 | 0.785 |
| 9:15 PM 12/14 | 2.53 | 0.785 |
| 9:00 PM 12/14 | 2.53 | 0.785 |
| 8:45 PM 12/14 | 2.54 | 0.794 |
| 8:30 PM 12/14 | 2.54 | 0.794 |
| 8:15 PM 12/14 | 2.55 | 0.802 |
| 8:00 PM 12/14 | 2.55 | 0.802 |
| 7:45 PM 12/14 | 2.56 | 0.811 |
| 7:30 PM 12/14 | 2.57 | 0.82 |
| 7:15 PM 12/14 | 2.57 | 0.82 |
20' -
Flooding will be widespread along the Winooski river from Jonesville to Lake Champlain. Water will cover Route 2 from Bolton to Williston, and Route 117 from Richmond to Essex. Bridge Street in Richmond, North Williston Road in Williston and Essex, Poor Farm Road in South Burlington and Williston floods. The Burlington Intervale will be inundated.
18' -
Flooding will be widespread along the Winooski River from Jonesville to the rivers mouth at Lake Champlain. Water will cover Bridge Street in Richmond, North Williston Road in Williston and Essex, Poor Farm Road in South Burlington and Williston. The Burlington Intervale will be inundated.
16' -
Low lying roads along the Winooski will flood, including Bridge Street in Richmond, North Williston Road in Essex, Poor Farm Road near the South Burlington and Essex town line, and Pine Island Road in Colchester. The Burlington Intervale will be inundated, and there will be widespread field flooding from Jonesville to Lake Champlain.
15' -
Flooding will occur on North Williston Road in Essex, Bridge Street and Volunteer Green in Richmond, and low lying roads in Jonesville. Water will inundate low lying fields along the Winooski from Jonesville to Burlington.
14' -
Flooding will occur on North Williston Road in Essex and Pine Island Road in Colchester. Water will approach Bridge Street and Volunteer Green in Richmond, and low lying roads in Jonesville. Low lying farmland in the Burlington Intervale will flood, as well as farmland along the Winooski from Bolton through Burlington.
13' -
Water will cover North Williston Road in Essex and Pine Island Road in Colchester. Low lying farmland in the Burlington Intervale will flood.
12.5' -
North Williston Road in Essex will begin to flood, and motorists should seek an alternate route. Water will flood farmland in the Burlington Intervale.
12' -
Farms in the Burlington Intervale begin to flood. Water will flood fields adjacent to North Williston Road in Essex and will approach North Williston Road.
| Date | Stage (ft) |
|---|---|
| Nov 4, 1927 | 51.4 |
| Mar 19, 1936 | 24.54 |
| Jul 11, 2023 | 23.28 |
| Aug 29, 2011 | 22.19 |
| Feb 21, 1981 | 22.17 |
| Dec 19, 2023 | 21.52 |
| Jul 11, 2024 | 20.48 |
| Mar 14, 1977 | 19.06 |
| Sep 22, 1938 | 18.72 |
| Apr 19, 1933 | 18.6 |
| Apr 18, 1982 | 18.28 |
| Jul 1, 1973 | 17.47 |
| Apr 13, 1934 | 17.32 |
| Apr 12, 2011 | 17.27 |
| Apr 1, 1987 | 17.13 |
| Apr 2, 1976 | 17.09 |
| Jan 20, 1996 | 17.09 |
| Jan 10, 1935 | 16.96 |
| May 5, 1972 | 16.87 |
| Dec 18, 2000 | 16.8 |
Data provided by the National Weather Service.