« Back to Northern Lights Rivers
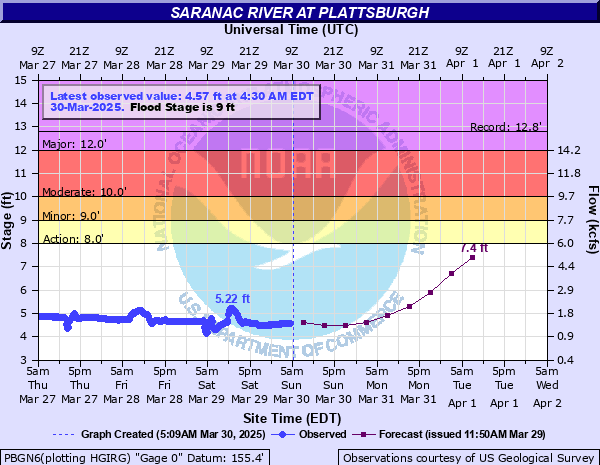
Saranac River at Plattsburgh
Critical Stages
8' - Action
9' - Flood
10' - Moderate
12' - Major
Latest Observation
Updated: 1:30 AM EST 12/15/25
Status: No Flooding
Stage: 3.63 ft
Flow: 0.742 kcfs
Forecast
| Time | Stage (ft) | Flow (kcfs) |
|---|---|---|
| 7 AM 12/15 | 3.4 | 0.592 |
| 1 PM 12/15 | 3.4 | 0.592 |
| 7 PM 12/15 | 3.4 | 0.592 |
| 1 AM 12/16 | 3.4 | 0.592 |
| 7 AM 12/16 | 3.4 | 0.592 |
| 1 PM 12/16 | 3.4 | 0.592 |
| 7 PM 12/16 | 3.4 | 0.592 |
| 1 AM 12/17 | 3.4 | 0.592 |
| 7 AM 12/17 | 3.4 | 0.592 |
| Time | Stage (ft) | Flow (kcfs) |
|---|---|---|
| 2:30 AM 12/15 | 3.61 | 0.728 |
| 2:15 AM 12/15 | 3.61 | 0.728 |
| 2:00 AM 12/15 | 3.61 | 0.728 |
| 1:45 AM 12/15 | 3.62 | 0.735 |
| 1:30 AM 12/15 | 3.63 | 0.742 |
| 1:15 AM 12/15 | 3.63 | 0.742 |
| 1:00 AM 12/15 | 3.63 | 0.742 |
| 12:45 AM 12/15 | 3.63 | 0.742 |
| 12:30 AM 12/15 | 3.64 | 0.748 |
| 12:15 AM 12/15 | 3.63 | 0.742 |
| 12:00 AM 12/15 | 3.64 | 0.748 |
| 11:45 PM 12/14 | 3.65 | 0.755 |
| 11:30 PM 12/14 | 3.66 | 0.762 |
| 11:15 PM 12/14 | 3.66 | 0.762 |
| 11:00 PM 12/14 | 3.65 | 0.755 |
| 10:45 PM 12/14 | 3.65 | 0.755 |
| 10:30 PM 12/14 | 3.65 | 0.755 |
| 10:15 PM 12/14 | 3.65 | 0.755 |
| 10:00 PM 12/14 | 3.65 | 0.755 |
| 9:45 PM 12/14 | 3.66 | 0.762 |
| 9:30 PM 12/14 | 3.64 | 0.748 |
| 9:15 PM 12/14 | 3.64 | 0.748 |
| 9:00 PM 12/14 | 3.63 | 0.742 |
| 8:45 PM 12/14 | 3.62 | 0.735 |
| 8:30 PM 12/14 | 3.61 | 0.728 |
| 8:15 PM 12/14 | 3.6 | 0.721 |
| 8:00 PM 12/14 | 3.61 | 0.728 |
| 7:45 PM 12/14 | 3.61 | 0.728 |
| 7:30 PM 12/14 | 3.6 | 0.721 |
| 7:15 PM 12/14 | 3.59 | 0.714 |
12' -
Water levels equal the November 1996 flooding. Underwood Trailer Park is protected by the levee, but it should be monitored for weakening. Flooding of lowlands occurs in Morrisonville east of Mason Street.
9' -
Underwood Trailer Park protected by levee if drain plugs are in. Levee should be monitored for weakening.
8' -
The Saranac River is at bankfull. The river is near the drainage holes in the levee at Underwood Trailer Park. No damage at this stage, but plugs should be placed in levee at Underwood Trailer Park to prevent water from entering.
| Date | Stage (ft) |
|---|---|
| Apr 8, 1928 | 12.8 |
| Nov 9, 1996 | 12.11 |
| May 12, 1943 | 10.9 |
| Apr 1, 1998 | 10.73 |
| Dec 30, 1984 | 10.08 |
| Apr 18, 1982 | 9.72 |
| Jun 3, 1947 | 9.57 |
| Apr 28, 2011 | 9.53 |
| Jun 12, 2013 | 9.49 |
| Mar 29, 1989 | 9.45 |
| Apr 2, 1973 | 9.39 |
| Dec 14, 1983 | 9.32 |
| Apr 12, 2011 | 9.25 |
| Apr 27, 2011 | 9.25 |
| Apr 4, 1963 | 9 |
| Apr 15, 1960 | 8.96 |
| Apr 17, 1994 | 8.94 |
| Apr 16, 2014 | 8.89 |
| Apr 30, 1956 | 8.77 |
| Mar 18, 1990 | 8.75 |
Data provided by the National Weather Service.