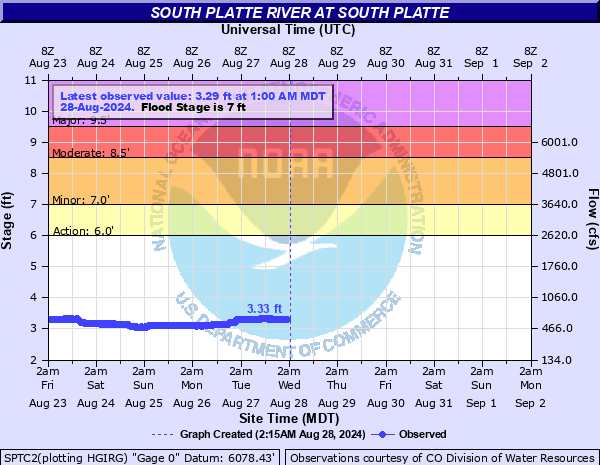
South Platte River at South Platte
Critical Stages
6' - Action
7' - Flood
8.5' - Moderate
9.5' - Major
Latest Observation
Updated: 2:00 PM MST 12/6/25
Status: No Flooding
Stage: 2.68 ft
Flow: 0.319 kcfs
Forecast
Forecast not available for this location.
| Time | Stage (ft) | Flow (kcfs) |
|---|---|---|
| 2:00 PM 12/6 | 2.68 | 0.319 |
| 1:45 PM 12/6 | 2.67 | 0.315 |
| 1:30 PM 12/6 | 2.67 | 0.315 |
| 1:15 PM 12/6 | 2.67 | 0.315 |
| 1:00 PM 12/6 | 2.66 | 0.311 |
| 12:45 PM 12/6 | 2.66 | 0.311 |
| 12:30 PM 12/6 | 2.66 | 0.311 |
| 12:15 PM 12/6 | 2.65 | 0.307 |
| 12:00 PM 12/6 | 2.66 | 0.311 |
| 11:45 AM 12/6 | 2.66 | 0.311 |
| 11:30 AM 12/6 | 2.66 | 0.311 |
| 11:15 AM 12/6 | 2.66 | 0.311 |
| 11:00 AM 12/6 | 2.65 | 0.307 |
| 10:45 AM 12/6 | 2.65 | 0.307 |
| 10:30 AM 12/6 | 2.65 | 0.307 |
| 10:15 AM 12/6 | 2.64 | 0.303 |
| 10:00 AM 12/6 | 2.64 | 0.303 |
| 9:45 AM 12/6 | 2.63 | 0.299 |
| 9:30 AM 12/6 | 2.63 | 0.299 |
| 9:15 AM 12/6 | 2.63 | 0.299 |
| 9:00 AM 12/6 | 2.63 | 0.299 |
| 8:45 AM 12/6 | 2.62 | 0.296 |
| 8:30 AM 12/6 | 2.62 | 0.296 |
| 8:15 AM 12/6 | 2.62 | 0.296 |
| 8:00 AM 12/6 | 2.62 | 0.296 |
| 7:45 AM 12/6 | 2.62 | 0.296 |
| 7:30 AM 12/6 | 2.62 | 0.296 |
| 7:15 AM 12/6 | 2.62 | 0.296 |
| 7:00 AM 12/6 | 2.61 | 0.292 |
| 6:45 AM 12/6 | 2.61 | 0.292 |
9.5' -
Major widespread flooding occurs in the canyon.
9' -
Many bridges crossing the South Platte River are impassable.
8.5' -
There is moderate flooding of bridges and rural roads. Structures begin to flood along the river.
8' -
Bridges and rural roads flood along the river.
7.5' -
High water could cause significant washing, and adversely affect bridges over the river. Campgrounds near the river are flooded.
7' -
Y Camp Road south of Deckers begins to flood. Campgrounds close to the river may also be impacted.
6.5' -
There is minor flooding of lowlands adjacent to the South Platte River.
6' -
The river begins to overflow into low lying areas upstream near Deckers.
| Date | Stage (ft) |
|---|---|
| Jul 12, 1996 | 11.2 |
| Jun 8, 1921 | 8.95 |
| Apr 30, 1970 | 8.24 |
| Apr 23, 1942 | 8.15 |
| Jun 14, 1949 | 7.96 |
| Jun 14, 2015 | 7.63 |
| Jun 18, 1995 | 7.32 |
| Jun 24, 1918 | 6.9 |
| May 22, 1973 | 6.85 |
| Jun 19, 1969 | 6.51 |
| Jul 31, 1998 | 6.09 |
| Jun 12, 1980 | 6.05 |
| Jul 6, 1911 | 5.95 |
| Jun 2, 1933 | 5.92 |
| Jun 24, 1947 | 5.86 |
| Jun 18, 1999 | 5.61 |
| Jun 30, 1912 | 5.6 |
| May 26, 1958 | 5.53 |
| Aug 21, 1945 | 5.48 |
| Jun 7, 1924 | 5.42 |
Data provided by the National Weather Service.