« Back to Northgate Country Club Rivers
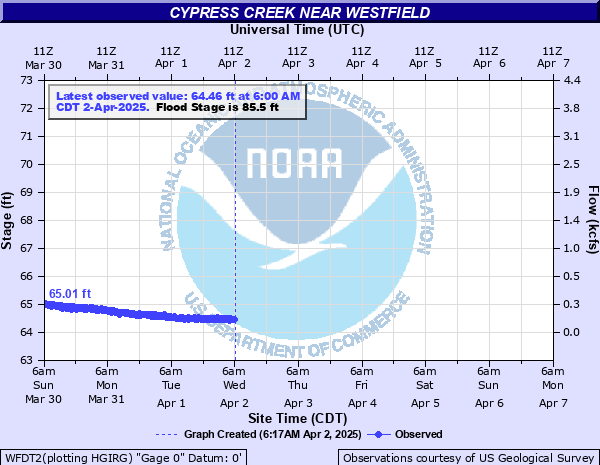
Cypress Creek near Westfield
Critical Stages
82.5' - Action
85.5' - Flood
88' - Moderate
90' - Major
Latest Observation
Updated: 5:00 PM CST 12/15/25
Status: No Flooding
Stage: 64.22 ft
Flow: 0.0634 kcfs
Forecast
Forecast not available for this location.
| Time | Stage (ft) | Flow (kcfs) |
|---|---|---|
| 5:00 PM 12/15 | 64.22 | 0.0634 |
| 4:45 PM 12/15 | 64.23 | 0.0652 |
| 4:30 PM 12/15 | 64.23 | 0.0652 |
| 4:15 PM 12/15 | 64.23 | 0.0652 |
| 4:00 PM 12/15 | 64.22 | 0.0634 |
| 3:45 PM 12/15 | 64.22 | 0.0634 |
| 3:30 PM 12/15 | 64.22 | 0.0634 |
| 3:15 PM 12/15 | 64.23 | 0.0652 |
| 3:00 PM 12/15 | 64.21 | 0.0617 |
| 2:45 PM 12/15 | 64.22 | 0.0634 |
| 2:30 PM 12/15 | 64.22 | 0.0634 |
| 2:15 PM 12/15 | 64.22 | 0.0634 |
| 2:00 PM 12/15 | 64.22 | 0.0634 |
| 1:45 PM 12/15 | 64.21 | 0.0617 |
| 1:30 PM 12/15 | 64.22 | 0.0634 |
| 1:15 PM 12/15 | 64.22 | 0.0634 |
| 1:00 PM 12/15 | 64.22 | 0.0634 |
| 12:45 PM 12/15 | 64.23 | 0.0652 |
| 12:30 PM 12/15 | 64.22 | 0.0634 |
| 12:15 PM 12/15 | 64.23 | 0.0652 |
| 12:00 PM 12/15 | 64.24 | 0.067 |
| 11:45 AM 12/15 | 64.23 | 0.0652 |
| 11:30 AM 12/15 | 64.23 | 0.0652 |
| 11:15 AM 12/15 | 64.22 | 0.0634 |
| 11:00 AM 12/15 | 64.23 | 0.0652 |
| 10:45 AM 12/15 | 64.23 | 0.0652 |
| 10:30 AM 12/15 | 64.23 | 0.0652 |
| 10:15 AM 12/15 | 64.24 | 0.067 |
| 10:00 AM 12/15 | 64.24 | 0.067 |
| 9:45 AM 12/15 | 64.24 | 0.067 |
90' -
Major lowland flooding begins with water to the bottom of I-45 bridge.
88' -
Moderate lowland flooding begins.
85.5' -
Minor lowland flooding begins.
| Date | Stage (ft) |
|---|---|
| Aug 29, 2017 | 97.12 |
| May 31, 1929 | 94.78 |
| Oct 8, 1949 | 94.22 |
| Nov 26, 1940 | 92.78 |
| Jun 9, 2001 | 92.12 |
| May 18, 1989 | 92.03 |
| Aug 31, 1945 | 91.81 |
| Jun 26, 1989 | 90.7 |
| Apr 18, 2016 | 90.57 |
| Jun 28, 1960 | 89.91 |
| Nov 6, 1946 | 89.9 |
| Oct 25, 1984 | 89.18 |
| Sep 1, 1981 | 89.01 |
| Sep 13, 2008 | 88.98 |
| Oct 18, 1998 | 88.68 |
| Jul 30, 1954 | 88.68 |
| Apr 18, 1973 | 88.44 |
| Apr 28, 2009 | 88.34 |
| Jun 2, 2016 | 87.85 |
| Oct 19, 1994 | 87.7 |
Data provided by the National Weather Service.