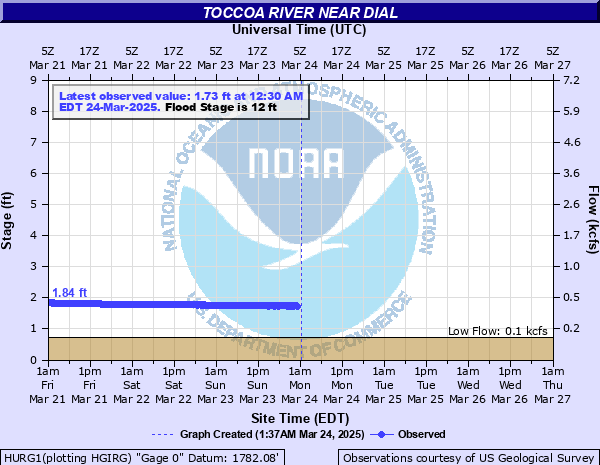
Toccoa River near Dial
Critical Stages
9' - Action
12' - Flood
15' - Moderate
17' - Major
Latest Observation
Updated: 5:30 PM EST 12/5/25
Status: No Flooding
Stage: 1.55 ft
Flow: 0.334 kcfs
Forecast
Forecast not available for this location.
| Time | Stage (ft) | Flow (kcfs) |
|---|---|---|
| 5:30 PM 12/5 | 1.55 | 0.334 |
| 5:15 PM 12/5 | 1.55 | 0.334 |
| 5:00 PM 12/5 | 1.55 | 0.334 |
| 4:45 PM 12/5 | 1.56 | 0.338 |
| 4:30 PM 12/5 | 1.56 | 0.338 |
| 4:15 PM 12/5 | 1.56 | 0.338 |
| 4:00 PM 12/5 | 1.57 | 0.342 |
| 3:45 PM 12/5 | 1.57 | 0.342 |
| 3:30 PM 12/5 | 1.57 | 0.342 |
| 3:15 PM 12/5 | 1.57 | 0.342 |
| 3:00 PM 12/5 | 1.58 | 0.345 |
| 2:45 PM 12/5 | 1.58 | 0.345 |
| 2:30 PM 12/5 | 1.58 | 0.345 |
| 2:15 PM 12/5 | 1.59 | 0.349 |
| 2:00 PM 12/5 | 1.59 | 0.349 |
| 1:45 PM 12/5 | 1.59 | 0.349 |
| 1:30 PM 12/5 | 1.6 | 0.353 |
| 1:15 PM 12/5 | 1.6 | 0.353 |
| 1:00 PM 12/5 | 1.6 | 0.353 |
| 12:45 PM 12/5 | 1.6 | 0.353 |
| 12:30 PM 12/5 | 1.6 | 0.353 |
| 12:15 PM 12/5 | 1.6 | 0.353 |
| 12:00 PM 12/5 | 1.6 | 0.353 |
| 11:45 AM 12/5 | 1.6 | 0.353 |
| 11:30 AM 12/5 | 1.6 | 0.353 |
| 11:15 AM 12/5 | 1.6 | 0.353 |
| 11:00 AM 12/5 | 1.59 | 0.349 |
| 10:45 AM 12/5 | 1.59 | 0.349 |
| 10:30 AM 12/5 | 1.59 | 0.349 |
| 10:15 AM 12/5 | 1.58 | 0.345 |
21' -
A catastrophic and massive flood will affect homes along the river upstream and downstream from the gage off Old Dial Road. The water level will be four feet deep over the Shallowford Bridge. Rapid flowing flood waters will cause extremely dangerous erosion conditions to the banks and may washout the bridge and damage homes. Flood waters will be 1 to 6 feet in some homes along the river. Portions of Upper Shallowford Road...Shallowford Bridge Road...Old Dial Road and Aska Road will be flooded.
19' -
Major flooding continues with widespread inundation flooding affecting the woodlands and homes along the river upstream and downstream from the gage off Old Dial Road. The water level will be two feet deep over the Shallowford Bridge. Rapid flowing flood waters will cause extremely dangerous erosion conditions to the banks and may washout the bridge. Flood waters will be 1 to 4 feet in some homes along the river. Portions of Upper Shallowford Road and Shallowford Bridge Road will begin to flood.
17' -
Major flooding begins. Widespread inundation flooding affects the woodlands and homes along the river upstream and downstream from the gage off Old Dial Road. The water level will be topping the Shallowford Bridge. Rapid flowing flood waters will cause extremely dangerous erosion conditions to the banks and may washout the bridge. Flood waters will be 1 to 2 feet in some homes along the river.
16' -
Significant flooding expands into the woodlands and yards of homes along the river upstream and downstream from the gage off Old Dial Road. The water level will be hitting the Shallowford Bridge. Rapid flowing flood waters will cause dangerous erosion conditions to the banks and the bridge should not be crossed. The water will begin to flood some homes along the river.
15' -
Moderate flooding begins. Significant flooding occurs in the woodlands and yards of homes along the river upstream and downstream from the gage off Old Dial Road. The water level will reach the bottom of the Shallowford Bridge. Rapid flowing flood waters will cause dangerous erosion conditions to the banks and the bridge should not be crossed. Flood waters will begin to approach the foundations of some of the homes along the river.
14' -
Minor flooding continues to expand into the woodlands and yards of homes along the river upstream and downstream from the gage off Old Dial Road around 1.5 miles upstream from the Shallowford Bridge. Rapid flowing flood waters will be up to two feet deep in the yards of the homes with possible erosion.
12' -
Flood stage is reached. Minor flooding begins with rapid flowing water in the woodlands and yards of homes along the river upstream and downstream from the gage off Old Dial Road around 1.5 miles upstream from the Shallowford Bridge.
9' -
Rapid flowing high water will cause bankfull conditions in the woodlands and yards of homes along the river upstream and downstream from the gage off Old Dial Road around 1.5 miles upstream from the Shallowford Bridge.
| Date | Stage (ft) |
|---|---|
| Nov 30, 1906 | 18.5 |
| Aug 23, 1967 | 13.73 |
| Mar 11, 1952 | 11.2 |
| Mar 4, 1979 | 11.19 |
| Dec 24, 2015 | 10.91 |
| Oct 4, 1964 | 10.78 |
| Aug 17, 2021 | 10.73 |
| Feb 16, 1990 | 10.13 |
| Jul 8, 1916 | 10 |
| May 28, 1973 | 9.95 |
| Mar 30, 1977 | 9.73 |
| Apr 2, 1936 | 9.6 |
| Jan 16, 1954 | 9.35 |
| Feb 10, 1921 | 9.25 |
| Jan 27, 1996 | 9.25 |
| Feb 10, 1946 | 9.13 |
| Mar 29, 1951 | 9.04 |
| Feb 25, 1961 | 9 |
| Dec 12, 1961 | 8.94 |
| May 15, 1976 | 8.82 |
Data provided by the National Weather Service.