« Back to Novi Township Rivers
Kearsley Creek near Davison
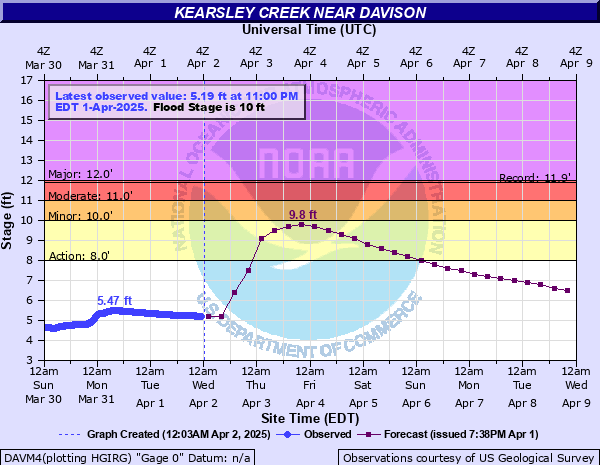
Critical Stages
8' - Action
10' - Flood
11' - Moderate
12' - Major
Latest Observation
Updated: 1:00 AM EST 12/5/25
Status: No Flooding
Stage: 3.94 ft
Flow: 0.0128 kcfs
Forecast
Forecast not available for this location.
| Time | Stage (ft) | Flow (kcfs) |
|---|---|---|
| 1:00 AM 12/5 | 3.94 | 0.0128 |
| 12:45 AM 12/5 | 3.95 | 0.0133 |
| 12:30 AM 12/5 | 3.97 | 0.0143 |
| 12:15 AM 12/5 | 3.98 | 0.0149 |
| 12:00 AM 12/5 | 3.99 | 0.0154 |
| 11:45 PM 12/4 | 4 | 0.016 |
| 11:30 PM 12/4 | 4.01 | 0.0163 |
| 11:15 PM 12/4 | 4.02 | 0.0166 |
| 11:00 PM 12/4 | 4.03 | 0.0169 |
| 10:45 PM 12/4 | 4.04 | 0.0171 |
| 10:30 PM 12/4 | 4.05 | 0.0174 |
| 10:15 PM 12/4 | 4.06 | 0.0177 |
| 10:00 PM 12/4 | 4.07 | 0.0181 |
| 9:45 PM 12/4 | 4.08 | 0.0184 |
| 9:30 PM 12/4 | 4.09 | 0.0187 |
| 9:15 PM 12/4 | 4.1 | 0.019 |
| 9:00 PM 12/4 | 4.11 | 0.0195 |
| 8:45 PM 12/4 | 4.12 | 0.0199 |
| 8:30 PM 12/4 | 4.13 | 0.0204 |
| 8:15 PM 12/4 | 4.14 | 0.0209 |
| 8:00 PM 12/4 | 4.15 | 0.0214 |
| 7:45 PM 12/4 | 4.16 | 0.0219 |
| 7:30 PM 12/4 | 4.17 | 0.0224 |
| 7:15 PM 12/4 | 4.17 | 0.0224 |
| 7:00 PM 12/4 | 4.18 | 0.0229 |
| 6:45 PM 12/4 | 4.19 | 0.0235 |
| 6:30 PM 12/4 | 4.19 | 0.0235 |
| 6:15 PM 12/4 | 4.2 | 0.024 |
| 6:00 PM 12/4 | 4.2 | 0.024 |
| 5:45 PM 12/4 | 4.2 | 0.024 |
11.85' -
The record flood of september 9, 1985 is reached
10' -
Water reaches the bottom of the Davison Road bridge and will begin to dam up against it. Flooding of some homes occurs just upstream of the Lippincott Blvd bridge.
8' -
Flooding occurs in low lying areas along the river. At this stage, no homes are affected. The creek runs through the Davison Athletic and Country Golf Club golf course where it floods low lying areas. Numerous backyards flood on both sides of the creek from near Davison golf course, upstream to around the Atlas Road bridge.
7' -
Overflow begins on both banks.
| Date | Stage (ft) |
|---|---|
| Sep 9, 1985 | 11.85 |
| Feb 10, 2001 | 11.4 |
| Apr 21, 1975 | 11.32 |
| Feb 21, 2018 | 11.24 |
| Oct 1, 1981 | 11.18 |
| May 19, 2011 | 10.82 |
| Apr 6, 2023 | 10.74 |
| Apr 19, 2013 | 10.68 |
| Jan 12, 2020 | 10.68 |
| Jul 11, 2024 | 10.67 |
| Jul 11, 2024 | 10.66 |
| Apr 12, 2013 | 10.56 |
| Apr 7, 2017 | 10.5 |
| Sep 30, 1986 | 10.49 |
| May 16, 2014 | 10.44 |
| Sep 5, 1981 | 10.37 |
| Apr 16, 2018 | 10.3 |
| Feb 2, 1968 | 10.29 |
| May 17, 1974 | 10.29 |
| Feb 2, 1971 | 10.29 |
Data provided by the National Weather Service.