« Back to Novi Township Rivers
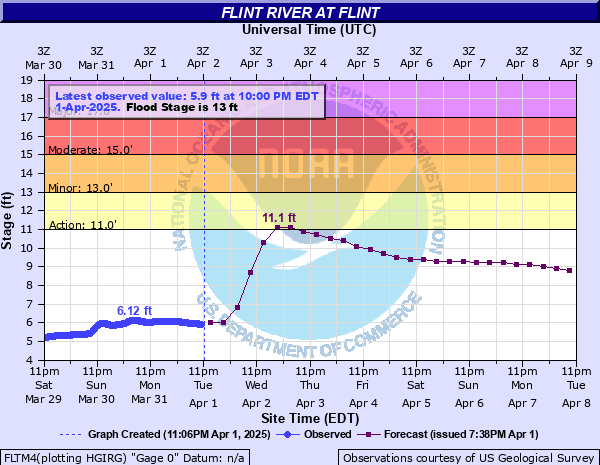
Flint River at Flint
Critical Stages
11' - Action
13' - Flood
15' - Moderate
17' - Major
Latest Observation
Updated: 1:00 AM EST 12/5/25
Status: No Flooding
Stage: 3.45 ft
Flow: 0.228 kcfs
Forecast
Forecast not available for this location.
| Time | Stage (ft) | Flow (kcfs) |
|---|---|---|
| 1:00 AM 12/5 | 3.45 | 0.228 |
| 12:45 AM 12/5 | 3.46 | 0.231 |
| 12:30 AM 12/5 | 3.46 | 0.231 |
| 12:15 AM 12/5 | 3.46 | 0.231 |
| 12:00 AM 12/5 | 3.46 | 0.231 |
| 11:45 PM 12/4 | 3.46 | 0.231 |
| 11:30 PM 12/4 | 3.46 | 0.231 |
| 11:15 PM 12/4 | 3.46 | 0.231 |
| 11:00 PM 12/4 | 3.46 | 0.231 |
| 10:45 PM 12/4 | 3.46 | 0.231 |
| 10:30 PM 12/4 | 3.46 | 0.231 |
| 10:15 PM 12/4 | 3.46 | 0.231 |
| 10:00 PM 12/4 | 3.46 | 0.231 |
| 9:45 PM 12/4 | 3.46 | 0.231 |
| 9:30 PM 12/4 | 3.46 | 0.231 |
| 9:15 PM 12/4 | 3.47 | 0.234 |
| 9:00 PM 12/4 | 3.47 | 0.234 |
| 8:45 PM 12/4 | 3.47 | 0.234 |
| 8:30 PM 12/4 | 3.47 | 0.234 |
| 8:15 PM 12/4 | 3.47 | 0.234 |
| 8:00 PM 12/4 | 3.47 | 0.234 |
| 7:45 PM 12/4 | 3.47 | 0.234 |
| 7:30 PM 12/4 | 3.47 | 0.234 |
| 7:15 PM 12/4 | 3.48 | 0.236 |
| 7:00 PM 12/4 | 3.47 | 0.234 |
| 6:45 PM 12/4 | 3.47 | 0.234 |
| 6:30 PM 12/4 | 3.48 | 0.236 |
| 6:15 PM 12/4 | 3.48 | 0.236 |
| 6:00 PM 12/4 | 3.48 | 0.236 |
| 5:45 PM 12/4 | 3.48 | 0.236 |
17' -
Several homes need to be evacuated in the Riverview subdivision of Flint Township. North Dort Highway (M-54) will likely be closed at the Flint River bridge.
15' -
Some homes may need to be evacuated in Riverview subdivision with several others surrounded by water. Several houses on Dutch Mill Drive in Flushing will be flooded. Riverbank Park in downtown Flint will almost be completely submerged.
14' -
Some homes in Flint Township experience minor flooding. Some buildings in Burton, along Thread Creek near where it enters the Flint River, sustain extensive basement damage.
13' -
Some basements and backyards along and near the river begin to flood. Water affects some roads along the river and its tributaries.
11' -
Lowlands begin to flood with little damage occurring. Water in Swartz and Thread Creek may back up and cause local flooding near where they enter the Flint River.
| Date | Stage (ft) |
|---|---|
| Sep 6, 1985 | 16.95 |
| Apr 6, 1947 | 16.35 |
| Feb 10, 2001 | 15.9 |
| Apr 19, 1975 | 14.99 |
| Oct 1, 1981 | 14.97 |
| May 19, 2011 | 14.78 |
| Feb 21, 2018 | 14.68 |
| Jun 24, 1996 | 14.1 |
| Sep 30, 1986 | 14.06 |
| May 24, 2004 | 14.03 |
| Mar 20, 1948 | 13.99 |
| May 4, 2012 | 13.9 |
| Apr 19, 2013 | 13.28 |
| Apr 7, 2017 | 13.24 |
| Apr 1, 1960 | 13.2 |
| Feb 21, 1997 | 13.2 |
| Dec 31, 1972 | 13.14 |
| Feb 23, 2018 | 13.13 |
| Mar 5, 1976 | 13.06 |
| Jun 2, 1943 | 12.95 |
Data provided by the National Weather Service.