« Back to Novi Township Rivers
Thread Creek near Flint
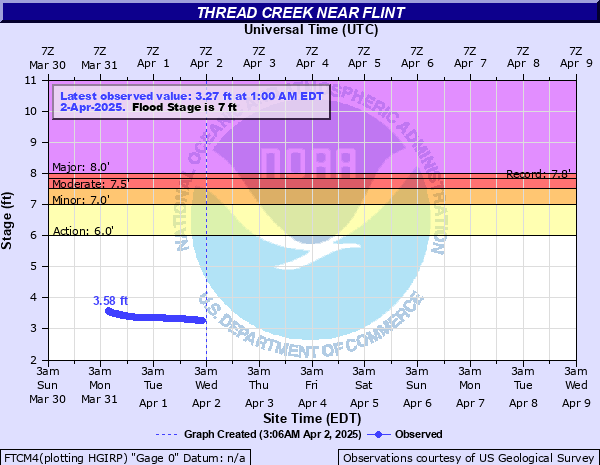
Critical Stages
6' - Action
7' - Flood
7.5' - Moderate
8' - Major
Latest Observation
Updated: 12:00 AM EST 12/5/25
Status: No Flooding
Stage: 1.98 ft
Flow: 0.0282 kcfs
Forecast
Forecast not available for this location.
| Time | Stage (ft) | Flow (kcfs) |
|---|---|---|
| 12:00 AM 12/5 | 1.98 | 0.0282 |
| 11:45 PM 12/4 | 1.97 | 0.0278 |
| 11:30 PM 12/4 | 1.97 | 0.0278 |
| 11:15 PM 12/4 | 1.97 | 0.0278 |
| 11:00 PM 12/4 | 1.97 | 0.0278 |
| 10:45 PM 12/4 | 1.97 | 0.0278 |
| 10:30 PM 12/4 | 1.97 | 0.0278 |
| 10:15 PM 12/4 | 1.95 | 0.027 |
| 10:00 PM 12/4 | 1.96 | 0.0274 |
| 9:45 PM 12/4 | 1.97 | 0.0278 |
| 9:30 PM 12/4 | 1.98 | 0.0282 |
| 9:15 PM 12/4 | 1.99 | 0.0286 |
| 9:00 PM 12/4 | 2.01 | 0.0294 |
| 8:45 PM 12/4 | 2.01 | 0.0294 |
| 8:30 PM 12/4 | 2.03 | 0.0302 |
| 8:15 PM 12/4 | 2.04 | 0.0306 |
| 8:00 PM 12/4 | 2.05 | 0.031 |
| 7:45 PM 12/4 | 2.06 | 0.0314 |
| 7:30 PM 12/4 | 2.07 | 0.0318 |
| 7:15 PM 12/4 | 2.08 | 0.0322 |
| 7:00 PM 12/4 | 2.08 | 0.0322 |
| 6:45 PM 12/4 | 2.09 | 0.0326 |
| 6:30 PM 12/4 | 2.09 | 0.0326 |
| 6:15 PM 12/4 | 2.1 | 0.033 |
| 6:00 PM 12/4 | 2.1 | 0.033 |
| 5:45 PM 12/4 | 2.11 | 0.0333 |
| 5:30 PM 12/4 | 2.11 | 0.0333 |
| 5:15 PM 12/4 | 2.11 | 0.0333 |
| 5:00 PM 12/4 | 2.11 | 0.0333 |
| 4:45 PM 12/4 | 2.11 | 0.0333 |
7' -
Significant flooding begins. This is most notable in the manufactured home community of Elms Park in Flint off of Dort Highway between Lippincott and Atherton Roads. Also, a few homes by the creek on Atherton Road experience flood effects.
4.8' -
Overflow begins along both banks.
| Date | Stage (ft) |
|---|---|
| Feb 23, 1985 | 7.82 |
| May 4, 2012 | 7.72 |
| Apr 19, 1975 | 7.65 |
| Feb 22, 2018 | 7.18 |
| Mar 13, 1982 | 7.1 |
| May 19, 2011 | 7.08 |
| May 17, 1974 | 6.48 |
| Mar 14, 1971 | 6.27 |
| Feb 15, 1976 | 6.13 |
| Jun 27, 1989 | 6.12 |
| Feb 18, 1981 | 6.08 |
| Mar 21, 1978 | 6.08 |
| Sep 29, 1986 | 6.07 |
| Sep 4, 1981 | 5.99 |
| Apr 16, 1972 | 5.95 |
| Dec 31, 1972 | 5.9 |
| Mar 4, 1979 | 5.87 |
| Mar 23, 1978 | 5.8 |
| Mar 19, 1980 | 5.54 |
| Jul 31, 1992 | 5.47 |
Data provided by the National Weather Service.