« Back to Novi Township Rivers
Grand River at Jackson
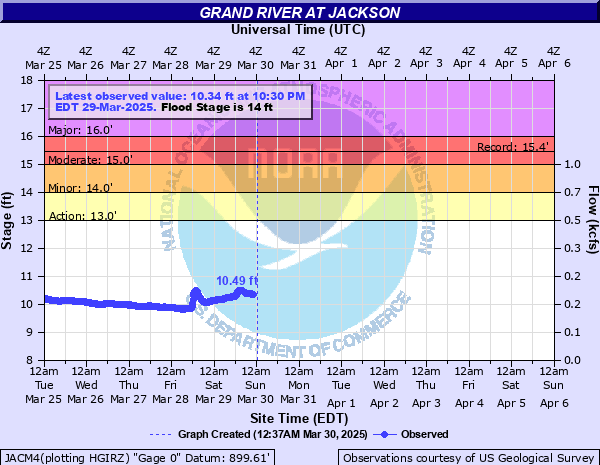
Critical Stages
13' - Action
14' - Flood
15' - Moderate
16' - Major
Latest Observation
Updated: 12:30 AM EST 12/5/25
Status: No Flooding
Stage: 9.11 ft
Flow: 0.0718 kcfs
Forecast
Forecast not available for this location.
| Time | Stage (ft) | Flow (kcfs) |
|---|---|---|
| 12:30 AM 12/5 | 9.11 | 0.0718 |
| 12:15 AM 12/5 | 9.12 | 0.0725 |
| 12:00 AM 12/5 | 9.14 | 0.0741 |
| 11:45 PM 12/4 | 9.16 | 0.0757 |
| 11:30 PM 12/4 | 9.18 | 0.0773 |
| 11:15 PM 12/4 | 9.2 | 0.079 |
| 11:00 PM 12/4 | 9.22 | 0.0805 |
| 10:45 PM 12/4 | 9.24 | 0.0821 |
| 10:30 PM 12/4 | 9.26 | 0.0837 |
| 10:15 PM 12/4 | 9.27 | 0.0845 |
| 10:00 PM 12/4 | 9.27 | 0.0845 |
| 9:45 PM 12/4 | 9.27 | 0.0845 |
| 9:30 PM 12/4 | 9.27 | 0.0845 |
| 9:15 PM 12/4 | 9.27 | 0.0845 |
| 9:00 PM 12/4 | 9.27 | 0.0845 |
| 8:45 PM 12/4 | 9.26 | 0.0837 |
| 8:30 PM 12/4 | 9.26 | 0.0837 |
| 8:15 PM 12/4 | 9.26 | 0.0837 |
| 8:00 PM 12/4 | 9.26 | 0.0837 |
| 7:45 PM 12/4 | 9.26 | 0.0837 |
| 7:30 PM 12/4 | 9.26 | 0.0837 |
| 7:15 PM 12/4 | 9.26 | 0.0837 |
| 7:00 PM 12/4 | 9.26 | 0.0837 |
| 6:45 PM 12/4 | 9.26 | 0.0837 |
| 6:30 PM 12/4 | 9.26 | 0.0837 |
| 6:15 PM 12/4 | 9.26 | 0.0837 |
| 6:00 PM 12/4 | 9.26 | 0.0837 |
| 5:45 PM 12/4 | 9.26 | 0.0837 |
| 5:30 PM 12/4 | 9.25 | 0.0829 |
| 5:15 PM 12/4 | 9.25 | 0.0829 |
16.5' -
Expect widespread street flooding, impassable roads and flooded basements. Expect major flooding of the industrial area downtown and businesses and residences along West Trail Street in an area east of Grand River Bridge, Lewis Street, High Street, and Losey Street.
16' -
Expect major flooding of residences along West Trail Street, Lewis Street, High Street, Losey Street and in areas east of Grand River Bridge. Railroad tracks inundated in low lying areas along river.
15' -
Expect moderate flooding of residences along High Street, Lewis Street, and Losey Street. High water would disrupt traffic and damage residences.
14' -
Expect minor flooding of low lying areas.
13' -
River is bankfull. River begins to flow into low lying areas.
| Date | Stage (ft) |
|---|---|
| Jun 25, 1968 | 15.44 |
| Aug 17, 1995 | 15.2 |
| Jul 10, 2024 | 15.12 |
| Aug 16, 2016 | 15.12 |
| Aug 12, 2021 | 14.81 |
| Oct 9, 2021 | 14.77 |
| Jun 6, 2010 | 14.66 |
| Sep 1, 2018 | 14.59 |
| Jun 25, 2000 | 14.47 |
| Sep 14, 2008 | 14.44 |
| May 18, 2020 | 14.35 |
| Apr 19, 2013 | 14.25 |
| May 15, 2018 | 14.24 |
| Jun 23, 2015 | 14.2 |
| Sep 25, 1986 | 14.2 |
| Jul 28, 2002 | 14.16 |
| Jan 5, 2007 | 14.1 |
| Feb 21, 2018 | 14.03 |
| Mar 11, 2009 | 13.98 |
| Apr 28, 2011 | 13.92 |
Data provided by the National Weather Service.