« Back to Novi Township Rivers
Red Cedar River near Williamston
Critical Stages
7' - Action
9' - Flood
10' - Moderate
10.5' - Major
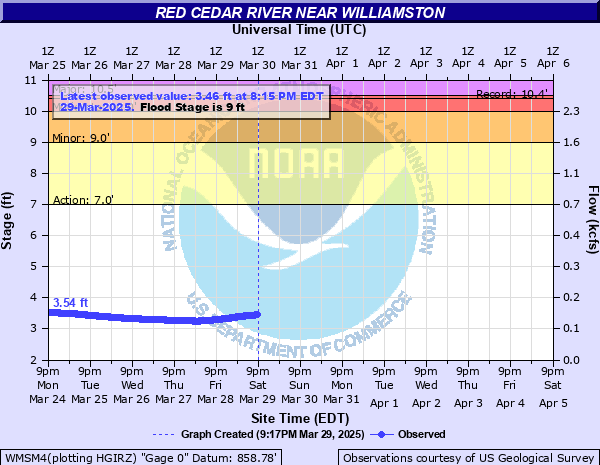
Latest Observation
Updated: 12:15 AM EST 12/5/25
Status: No Flooding
Stage: 2.6 ft
Flow: 0.036 kcfs
Forecast
Forecast not available for this location.
| Time | Stage (ft) | Flow (kcfs) |
|---|---|---|
| 12:15 AM 12/5 | 2.6 | 0.036 |
| 12:00 AM 12/5 | 2.6 | 0.036 |
| 11:45 PM 12/4 | 2.6 | 0.036 |
| 11:30 PM 12/4 | 2.6 | 0.036 |
| 11:15 PM 12/4 | 2.6 | 0.036 |
| 11:00 PM 12/4 | 2.6 | 0.036 |
| 10:45 PM 12/4 | 2.6 | 0.036 |
| 10:30 PM 12/4 | 2.61 | 0.0366 |
| 10:15 PM 12/4 | 2.61 | 0.0366 |
| 10:00 PM 12/4 | 2.62 | 0.0371 |
| 9:45 PM 12/4 | 2.63 | 0.0377 |
| 9:30 PM 12/4 | 2.63 | 0.0377 |
| 9:15 PM 12/4 | 2.63 | 0.0377 |
| 9:00 PM 12/4 | 2.63 | 0.0377 |
| 8:45 PM 12/4 | 2.63 | 0.0377 |
| 8:30 PM 12/4 | 2.63 | 0.0377 |
| 8:15 PM 12/4 | 2.62 | 0.0371 |
| 8:00 PM 12/4 | 2.62 | 0.0371 |
| 7:45 PM 12/4 | 2.61 | 0.0366 |
| 7:30 PM 12/4 | 2.6 | 0.036 |
| 7:15 PM 12/4 | 2.59 | 0.0355 |
| 7:00 PM 12/4 | 2.58 | 0.035 |
| 6:45 PM 12/4 | 2.57 | 0.0344 |
| 6:30 PM 12/4 | 2.55 | 0.0334 |
| 6:15 PM 12/4 | 2.54 | 0.0329 |
| 6:00 PM 12/4 | 2.53 | 0.0324 |
| 5:45 PM 12/4 | 2.52 | 0.032 |
| 5:30 PM 12/4 | 2.51 | 0.0315 |
| 5:15 PM 12/4 | 2.48 | 0.0299 |
| 5:00 PM 12/4 | 2.48 | 0.0299 |
10' -
Expect moderate flooding of homes in the Williamston area. Several homes in Williamston have first floor flooding.
9' -
Expect minor basement flooding of several homes in Williamston.
8' -
Expect minor flooding of golf course and adjacent park in Williamston.
7' -
River is bankfull. Overflow begins in low lying areas adjacent to the river.
| Date | Stage (ft) |
|---|---|
| Apr 19, 1975 | 10.41 |
| Feb 22, 2018 | 9.3 |
| Feb 26, 1985 | 9.07 |
| Jul 8, 1994 | 9 |
| Apr 25, 1999 | 8.5 |
| Mar 15, 1982 | 8.42 |
| Apr 7, 2017 | 8.38 |
| May 19, 2020 | 8.18 |
| Feb 18, 2022 | 8 |
| Apr 6, 2023 | 7.99 |
| Sep 17, 2008 | 7.91 |
| May 16, 2014 | 7.84 |
| Apr 20, 2013 | 7.79 |
| Mar 14, 1986 | 7.74 |
| Jul 11, 2024 | 7.67 |
| Mar 11, 2009 | 7.6 |
| Mar 5, 1976 | 7.6 |
| Jan 9, 2008 | 7.56 |
| Feb 19, 1981 | 7.48 |
| Aug 12, 2021 | 7.47 |
Data provided by the National Weather Service.