Cicero Creek at Arcadia
Critical Stages
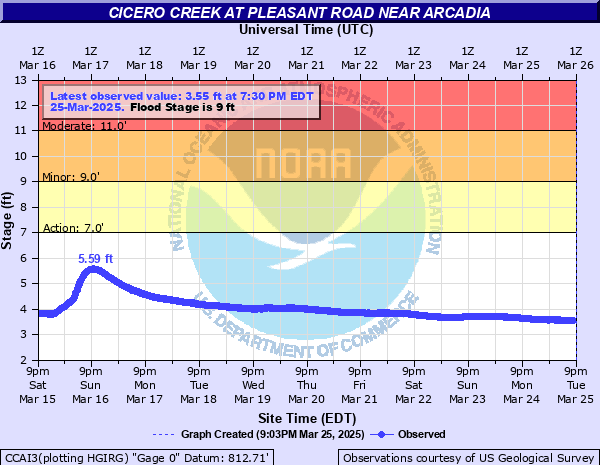
7' - Action
9' - Flood
11' - Moderate
13' - Major
Latest Observation
Updated: 12:30 AM EST 12/6/25
Status: No Flooding
Stage: 2.87 ft
Flow: -999 kcfs
Forecast
Forecast not available for this location.
| Time | Stage (ft) | Flow (kcfs) |
|---|---|---|
| 12:30 AM 12/6 | 2.87 | -999 |
| 12:15 AM 12/6 | 2.87 | -999 |
| 12:00 AM 12/6 | 2.87 | -999 |
| 11:45 PM 12/5 | 2.87 | -999 |
| 11:30 PM 12/5 | 2.87 | -999 |
| 11:15 PM 12/5 | 2.87 | -999 |
| 11:00 PM 12/5 | 2.87 | -999 |
| 10:45 PM 12/5 | 2.87 | -999 |
| 10:30 PM 12/5 | 2.86 | -999 |
| 10:15 PM 12/5 | 2.86 | -999 |
| 10:00 PM 12/5 | 2.86 | -999 |
| 9:45 PM 12/5 | 2.86 | -999 |
| 9:30 PM 12/5 | 2.85 | -999 |
| 9:15 PM 12/5 | 2.85 | -999 |
| 9:00 PM 12/5 | 2.84 | -999 |
| 8:45 PM 12/5 | 2.82 | -999 |
| 8:30 PM 12/5 | 2.8 | -999 |
| 8:15 PM 12/5 | 2.79 | -999 |
| 8:00 PM 12/5 | 2.78 | -999 |
| 7:45 PM 12/5 | 2.78 | -999 |
| 7:30 PM 12/5 | 2.79 | -999 |
| 7:15 PM 12/5 | 2.79 | -999 |
| 7:00 PM 12/5 | 2.8 | -999 |
| 6:45 PM 12/5 | 2.81 | -999 |
| 6:30 PM 12/5 | 2.82 | -999 |
| 6:15 PM 12/5 | 2.83 | -999 |
| 6:00 PM 12/5 | 2.84 | -999 |
| 5:45 PM 12/5 | 2.85 | -999 |
| 5:30 PM 12/5 | 2.86 | -999 |
| 5:15 PM 12/5 | 2.86 | -999 |
14' -
Two motorists perished on 266th street near Arcadia in April 2013 while attempting to drive through water more than 3 feet deep. Similar levels also on Mt. Pleasant Road. This was a record flood on Cicero Creek.
13' -
Major flooding of Cicero Creek. Both 266th street and Mt. Pleasant Road at Cicero Creek are impassable. Water is more than 2 feet deep or more on both roads.
12' -
Significant flooding of Cicero Creek in Arcadia area. Water flowing over 266th street west of bridge over Cicero Creek and over Mt. Pleasant Rd just south of bridge over Cicero Creek.
11.5' -
Extensive lowland flooding of Cicero Creek. Water is six inches deep on 266th Street just west of Cicero Creek and about half way across of Mt. Pleasant road just south of Cicero Creek.
10' -
Noticeable flooding of Cicero Creek just east of Arcadia.
9' -
Some flooding of Cicero Creek along Mt. Pleasant Rd and 266th Street near Arcadia.
| Date | Stage (ft) |
|---|---|
| Apr 20, 2013 | 14.03 |
| May 6, 2017 | 12.51 |
| Jan 13, 2005 | 12.15 |
| Jun 27, 2015 | 11.74 |
| Jun 24, 2010 | 11.51 |
| Mar 24, 2007 | 11.48 |
| Jan 14, 2013 | 11.37 |
| Jun 28, 2010 | 11.1 |
| Feb 12, 2009 | 11.08 |
| Jun 21, 2011 | 10.91 |
| Feb 6, 2008 | 10.72 |
| Apr 4, 2018 | 10.67 |
| Mar 1, 2011 | 10.56 |
| Jan 15, 2007 | 10.52 |
| Dec 29, 2015 | 10.47 |
| Apr 4, 2014 | 10.33 |
| Jul 8, 2017 | 10.26 |
| Nov 19, 2017 | 9.73 |
| Jan 20, 2017 | 9.66 |
| Jan 9, 2008 | 9.54 |
Data provided by the National Weather Service.