Fall Creek (IN) near Fortville
Critical Stages
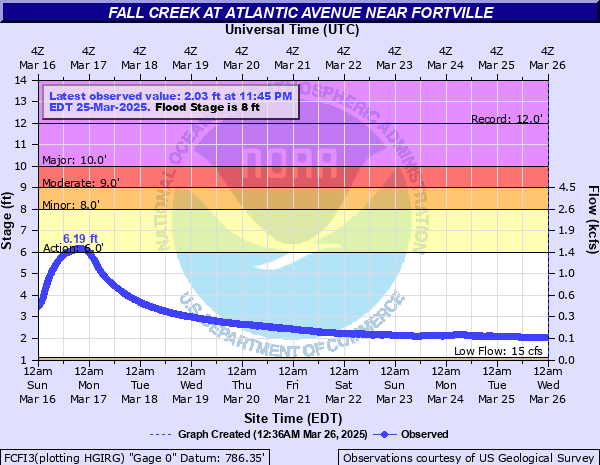
6' - Action
8' - Flood
9' - Moderate
10' - Major
Latest Observation
Updated: 12:45 AM EST 12/6/25
Status: No Flooding
Stage: 1.49 ft
Flow: 0.0541 kcfs
Forecast
Forecast not available for this location.
| Time | Stage (ft) | Flow (kcfs) |
|---|---|---|
| 12:45 AM 12/6 | 1.49 | 0.0541 |
| 12:30 AM 12/6 | 1.49 | 0.0541 |
| 12:15 AM 12/6 | 1.48 | 0.053 |
| 12:00 AM 12/6 | 1.48 | 0.053 |
| 11:45 PM 12/5 | 1.48 | 0.053 |
| 11:30 PM 12/5 | 1.49 | 0.0541 |
| 11:15 PM 12/5 | 1.48 | 0.053 |
| 11:00 PM 12/5 | 1.48 | 0.053 |
| 10:45 PM 12/5 | 1.48 | 0.053 |
| 10:30 PM 12/5 | 1.48 | 0.053 |
| 10:15 PM 12/5 | 1.49 | 0.0541 |
| 10:00 PM 12/5 | 1.49 | 0.0541 |
| 9:45 PM 12/5 | 1.5 | 0.0553 |
| 9:30 PM 12/5 | 1.52 | 0.0576 |
| 9:15 PM 12/5 | 1.53 | 0.0588 |
| 9:00 PM 12/5 | 1.53 | 0.0588 |
| 8:45 PM 12/5 | 1.52 | 0.0576 |
| 8:30 PM 12/5 | 1.52 | 0.0576 |
| 8:15 PM 12/5 | 1.51 | 0.0564 |
| 8:00 PM 12/5 | 1.51 | 0.0564 |
| 7:45 PM 12/5 | 1.51 | 0.0564 |
| 7:30 PM 12/5 | 1.51 | 0.0564 |
| 7:15 PM 12/5 | 1.51 | 0.0564 |
| 7:00 PM 12/5 | 1.51 | 0.0564 |
| 6:45 PM 12/5 | 1.5 | 0.0553 |
| 6:30 PM 12/5 | 1.48 | 0.053 |
| 6:15 PM 12/5 | 1.47 | 0.0518 |
| 6:00 PM 12/5 | 1.46 | 0.0507 |
| 5:45 PM 12/5 | 1.45 | 0.0495 |
| 5:30 PM 12/5 | 1.45 | 0.0495 |
12' -
Near record flooding along Fall Creek as level approaches that seen last in March 1913. Most local roads near Fall Creek in southwest Madison, southeast Hamilton and northeast Marion Counties are flooded worse than December 2013. Residential areas near Luxhaven may be threatened.
10' -
Extensive flooding along Fall Creek in Madison County. All roads along Fall Creek in Madison County were closed by high water. Former State Road 238 was flooded. The flood crest of 10.4 feet in December 2013 was believed to be the highest since March 1913.
9.5' -
Water on SR 238 at gaging site near Fortville. Flooding possible in low areas of Luxhaven.
9' -
Fall Creek at the edge of SR 238 at gaging site near Fortville.
7.5' -
Overflow begins along both banks at the SR 238 bridge areas and vicinity.
6' -
Bankfull level. Cultivated fields on left bank begin to flood.
| Date | Stage (ft) |
|---|---|
| Mar 26, 1913 | 12 |
| Dec 22, 2013 | 10.39 |
| Mar 5, 1963 | 9.99 |
| Apr 21, 1964 | 9.88 |
| Dec 31, 1990 | 9.83 |
| Sep 2, 2003 | 9.83 |
| May 18, 1943 | 9.77 |
| Nov 15, 1993 | 9.44 |
| Jun 5, 2008 | 9.38 |
| Apr 6, 2025 | 9.34 |
| Apr 12, 2024 | 9.14 |
| Jul 8, 2017 | 9.13 |
| Jun 17, 2019 | 9.03 |
| Jan 14, 2013 | 9 |
| May 13, 2002 | 8.95 |
| Jun 23, 2010 | 8.93 |
| Apr 4, 2018 | 8.91 |
| Apr 26, 1961 | 8.89 |
| Jan 4, 1950 | 8.85 |
| Jun 14, 1958 | 8.82 |
Data provided by the National Weather Service.