White River (IN) at Indianapolis Museum of Art
Critical Stages
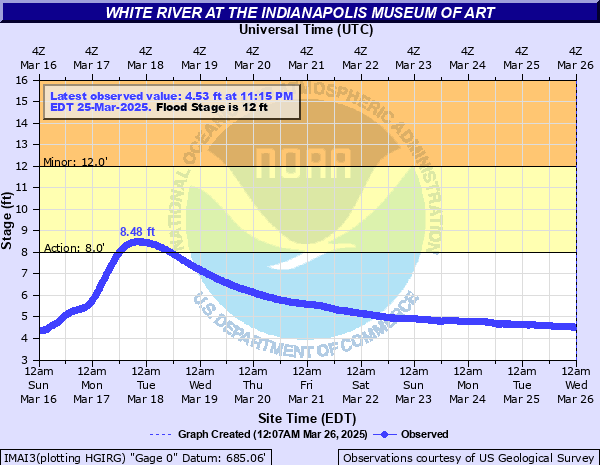
8' - Action
12' - Flood
16' - Moderate
25' - Major
Latest Observation
Updated: 12:15 AM EST 12/6/25
Status: No Flooding
Stage: 2.95 ft
Flow: -999 kcfs
Forecast
Forecast not available for this location.
| Time | Stage (ft) | Flow (kcfs) |
|---|---|---|
| 12:15 AM 12/6 | 2.95 | -999 |
| 12:00 AM 12/6 | 2.96 | -999 |
| 11:45 PM 12/5 | 2.96 | -999 |
| 11:30 PM 12/5 | 2.96 | -999 |
| 11:15 PM 12/5 | 2.96 | -999 |
| 11:00 PM 12/5 | 2.96 | -999 |
| 10:45 PM 12/5 | 2.96 | -999 |
| 10:30 PM 12/5 | 2.96 | -999 |
| 10:15 PM 12/5 | 2.96 | -999 |
| 10:00 PM 12/5 | 2.96 | -999 |
| 9:45 PM 12/5 | 2.96 | -999 |
| 9:30 PM 12/5 | 2.95 | -999 |
| 9:15 PM 12/5 | 2.96 | -999 |
| 9:00 PM 12/5 | 2.95 | -999 |
| 8:45 PM 12/5 | 2.95 | -999 |
| 8:30 PM 12/5 | 2.95 | -999 |
| 8:15 PM 12/5 | 2.95 | -999 |
| 8:00 PM 12/5 | 2.95 | -999 |
| 7:45 PM 12/5 | 2.94 | -999 |
| 7:30 PM 12/5 | 2.94 | -999 |
| 7:15 PM 12/5 | 2.94 | -999 |
| 7:00 PM 12/5 | 2.94 | -999 |
| 6:45 PM 12/5 | 2.95 | -999 |
| 6:30 PM 12/5 | 2.94 | -999 |
| 6:15 PM 12/5 | 2.94 | -999 |
| 6:00 PM 12/5 | 2.94 | -999 |
| 5:45 PM 12/5 | 2.95 | -999 |
| 5:30 PM 12/5 | 2.94 | -999 |
| 5:15 PM 12/5 | 2.94 | -999 |
| 5:00 PM 12/5 | 2.95 | -999 |
25' -
Approaching the high water mark of the March 1913 of 25.90 feet. A devastating flood upstream in the Ravenswood area. Flood waters approaching or over the Central Canal Trail.
17' -
Flood waters begin to affect Indianapolis Museum of Art property located in the White River flood plain. This is a preliminary estimate by the Indiana U.S. Geological Survey.
| Date | Stage (ft) |
|---|---|
| Mar 26, 1913 | 25.9 |
| Apr 23, 1964 | 18.9 |
| Jun 15, 1958 | 18.3 |
| Apr 20, 2013 | 17.65 |
| Mar 2, 2011 | 16.48 |
| Mar 7, 1963 | 16.4 |
| Jan 15, 2013 | 16.31 |
| May 6, 2017 | 16.25 |
| Apr 7, 2025 | 16.09 |
| Feb 8, 2008 | 15.67 |
| Jun 29, 2015 | 15.33 |
| Dec 24, 2013 | 15.21 |
| Apr 5, 2018 | 15.02 |
| Jan 28, 1962 | 14.6 |
| Jun 23, 2010 | 14.52 |
| Apr 5, 2014 | 14.43 |
| Dec 29, 2015 | 13.85 |
| Feb 13, 2009 | 13.78 |
| Apr 28, 2019 | 13.63 |
| Mar 5, 2023 | 12.83 |
Data provided by the National Weather Service.