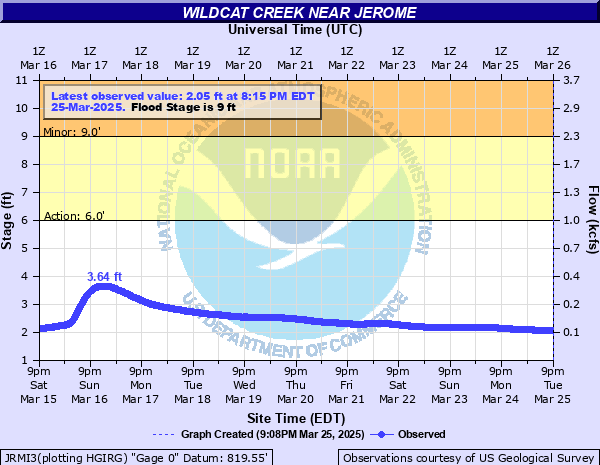
Wildcat Creek (IN) near Jerome
Critical Stages
6' - Action
9' - Flood
12' - Moderate
16' - Major
Latest Observation
Updated: 12:15 AM EST 12/6/25
Status: No Flooding
Stage: 1.72 ft
Flow: 0.0189 kcfs
Forecast
Forecast not available for this location.
| Time | Stage (ft) | Flow (kcfs) |
|---|---|---|
| 12:15 AM 12/6 | 1.72 | 0.0189 |
| 12:00 AM 12/6 | 1.72 | 0.0189 |
| 11:45 PM 12/5 | 1.72 | 0.0189 |
| 11:30 PM 12/5 | 1.72 | 0.0189 |
| 11:15 PM 12/5 | 1.72 | 0.0189 |
| 11:00 PM 12/5 | 1.72 | 0.0189 |
| 10:45 PM 12/5 | 1.72 | 0.0189 |
| 10:30 PM 12/5 | 1.72 | 0.0189 |
| 10:15 PM 12/5 | 1.72 | 0.0189 |
| 10:00 PM 12/5 | 1.72 | 0.0189 |
| 9:45 PM 12/5 | 1.72 | 0.0189 |
| 9:30 PM 12/5 | 1.72 | 0.0189 |
| 9:15 PM 12/5 | 1.72 | 0.0189 |
| 9:00 PM 12/5 | 1.72 | 0.0189 |
| 8:45 PM 12/5 | 1.72 | 0.0189 |
| 8:30 PM 12/5 | 1.72 | 0.0189 |
| 8:15 PM 12/5 | 1.72 | 0.0189 |
| 8:00 PM 12/5 | 1.72 | 0.0189 |
| 7:45 PM 12/5 | 1.72 | 0.0189 |
| 7:30 PM 12/5 | 1.72 | 0.0189 |
| 7:15 PM 12/5 | 1.72 | 0.0189 |
| 7:00 PM 12/5 | 1.72 | 0.0189 |
| 6:45 PM 12/5 | 1.72 | 0.0189 |
| 6:30 PM 12/5 | 1.72 | 0.0189 |
| 6:15 PM 12/5 | 1.72 | 0.0189 |
| 6:00 PM 12/5 | 1.72 | 0.0189 |
| 5:45 PM 12/5 | 1.72 | 0.0189 |
| 5:30 PM 12/5 | 1.72 | 0.0189 |
| 5:15 PM 12/5 | 1.72 | 0.0189 |
| 5:00 PM 12/5 | 1.72 | 0.0189 |
18' -
Record flooding. Residential flooding possible. Local roads are extensively flooded.
16' -
Major flooding along Wildcat Creek in the Jerome and SR 213 area. Possibly some residential flooding. Most local roads near the creek are flooded.
14' -
Significant flooding in progress along this portion of Wildcat Creek. Only two floods since 1961...July 2003 and April 2013...crested above this level. Flood affects most roads near Wildcat Creek and the canoe launch near SR 213.
12' -
Extensive flooding of Wildcat Creek in Jerome area. CR 1050 E just south of Jerome begins to flood. Extensive flooding of canoe launch site and park near SR 213.
9' -
Flooding in progress along Wildcat Creek in eastern Howard County. Water possibly two feet deep on CR 174 S just west of Jerome Bridge on CR 1030 E. Canoe area at SR 213 and nearby park flooded.
7' -
Howard CR 174 S located just west of Jerome Bridge on CR 1030 E begins to flood.
| Date | Stage (ft) |
|---|---|
| Mar 24, 1913 | 18 |
| Apr 19, 2013 | 16.19 |
| Jul 6, 2003 | 14.35 |
| Dec 30, 1990 | 13.71 |
| Jun 12, 1998 | 13.43 |
| Jun 3, 1980 | 13.34 |
| Jul 14, 1992 | 13.31 |
| Jan 23, 1999 | 13.3 |
| Jan 13, 2013 | 12.8 |
| Sep 2, 1989 | 12.62 |
| Jun 27, 2015 | 12.38 |
| Feb 12, 2009 | 12.35 |
| Feb 27, 1997 | 12.32 |
| Feb 23, 1985 | 12.23 |
| Nov 12, 1992 | 11.99 |
| Jan 26, 1962 | 11.98 |
| Apr 20, 1964 | 11.8 |
| May 5, 2017 | 11.8 |
| Feb 17, 1976 | 11.38 |
| Feb 6, 2008 | 11.24 |
Data provided by the National Weather Service.