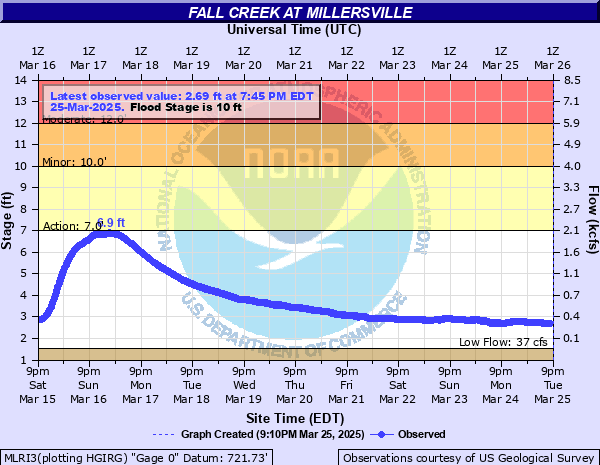
Fall Creek (IN) at Millersville
Critical Stages
7' - Action
10' - Flood
12' - Moderate
Major
Latest Observation
Updated: 12:45 AM EST 12/6/25
Status: No Flooding
Stage: 1.82 ft
Flow: 0.0635 kcfs
Forecast
Forecast not available for this location.
| Time | Stage (ft) | Flow (kcfs) |
|---|---|---|
| 12:45 AM 12/6 | 1.82 | 0.0635 |
| 12:30 AM 12/6 | 1.82 | 0.0635 |
| 12:15 AM 12/6 | 1.82 | 0.0635 |
| 12:00 AM 12/6 | 1.82 | 0.0635 |
| 11:45 PM 12/5 | 1.82 | 0.0635 |
| 11:30 PM 12/5 | 1.82 | 0.0635 |
| 11:15 PM 12/5 | 1.82 | 0.0635 |
| 11:00 PM 12/5 | 1.82 | 0.0635 |
| 10:45 PM 12/5 | 1.82 | 0.0635 |
| 10:30 PM 12/5 | 1.82 | 0.0635 |
| 10:15 PM 12/5 | 1.82 | 0.0635 |
| 10:00 PM 12/5 | 1.83 | 0.065 |
| 9:45 PM 12/5 | 1.83 | 0.065 |
| 9:30 PM 12/5 | 1.83 | 0.065 |
| 9:15 PM 12/5 | 1.83 | 0.065 |
| 9:00 PM 12/5 | 1.83 | 0.065 |
| 8:45 PM 12/5 | 1.83 | 0.065 |
| 8:30 PM 12/5 | 1.83 | 0.065 |
| 8:15 PM 12/5 | 1.83 | 0.065 |
| 8:00 PM 12/5 | 1.83 | 0.065 |
| 7:45 PM 12/5 | 1.83 | 0.065 |
| 7:30 PM 12/5 | 1.83 | 0.065 |
| 7:15 PM 12/5 | 1.83 | 0.065 |
| 7:00 PM 12/5 | 1.83 | 0.065 |
| 6:45 PM 12/5 | 1.83 | 0.065 |
| 6:30 PM 12/5 | 1.83 | 0.065 |
| 6:15 PM 12/5 | 1.83 | 0.065 |
| 6:00 PM 12/5 | 1.83 | 0.065 |
| 5:45 PM 12/5 | 1.83 | 0.065 |
| 5:30 PM 12/5 | 1.83 | 0.065 |
15.58' -
Near record flooding along Fall Creek. On September 2, 2003 one motorist drowned because rescuers could not reach her because of the swift water.
14' -
Extensive flooding in the Emerson and 56th Street area along Fall Creek. 56th Street closed due to high water.
13' -
Extensive flooding along Fall Creek. Local roads are flooded. Building northeast of gaging site can be flooded by a few feet of water if flood protection fails.
10' -
Parking lot of commercial district area at 5440 Fall Creek Parkway North Drive just northeast of gaging site begins to flood.
8.5' -
Bankfull level. Walking trail along Fall Creek is flooded.
| Date | Stage (ft) |
|---|---|
| Mar 26, 1913 | 16.3 |
| Sep 2, 2003 | 15.68 |
| Dec 23, 2013 | 14.34 |
| Jan 6, 2005 | 13.71 |
| May 28, 1956 | 13.53 |
| Dec 31, 1990 | 13.36 |
| Mar 1, 2011 | 12.85 |
| Apr 21, 1964 | 12.78 |
| Apr 6, 2025 | 12.73 |
| Mar 6, 1963 | 12.32 |
| Nov 15, 1993 | 12.2 |
| Jan 14, 2013 | 12.09 |
| Apr 13, 2024 | 12.04 |
| Jun 5, 2008 | 11.81 |
| May 14, 1933 | 11.77 |
| May 5, 2017 | 11.56 |
| Jun 11, 1958 | 11.56 |
| Jun 17, 2019 | 11.47 |
| Apr 4, 2018 | 11.38 |
| May 18, 1943 | 11.34 |
Data provided by the National Weather Service.