White River (IN) at Ravenswood
Critical Stages
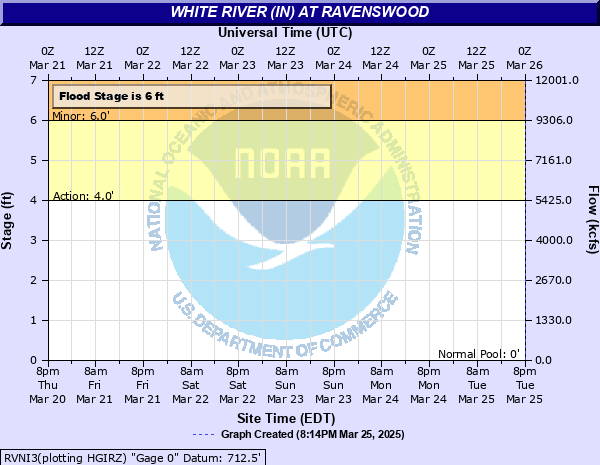
4' - Action
6' - Flood
10' - Moderate
12' - Major
Latest Observation
Updated: 7:03 PM LMT 12/31/00
Status: Obs Not Current
Stage: -999 ft
Flow: -999 kcfs
Forecast
Forecast not available for this location.
Observation history not available.
14.5' -
Approaching record flood level. Worst flooding in nearly 100 years. Major destruction in Ravenswood and likely failing of levee at Rocky Ripple. Nearing first floor flooding in Mystic Bay area. Critical stage on Warfleigh levee in Broad Ripple. Numerous local roads on north side of Indianapolis flooded.
13.5' -
Flood levels at the highest level since March 1913 and just above the May 1943 flood. Extensive flooding with many evacuations in the Ravenswood area. Possible breaching of levee in the Rocky Ripple Area.
12.5' -
Major flooding in Ravenswood. Evacuations ordered for all residents in Ravenswood west of Crittenden Avenue. Water near the top of levee protecting Rocky Ripple. Water at critical levels for Warfleigh levee in Broad Ripple. Numerous local roads extensively flooded on the north side of Indianapolis.
12' -
Large portion of Ravenswood experiences major flood damage. Extensive flooding in the Mystic Bay area closes roads and affects lower garage areas.
11.2' -
Several streets flooded by a foot or more of water.
10' -
Serious flooding begins in the Ravenswood area.
9' -
High water affects Ravenswood and River Edge Drive. Many basements in Ravenswood fill with one to two feet of water. Some basements fill with three feet or more feet of water.
8' -
Basements begin to flood in Ravenswood area. Flood waters begin to affect residential parking in the Broad Ripple area.
7.5' -
River Road floods.
7' -
Water surrounds homes in River Edge Estates. A few streets flood in Ravenswood.
6' -
Lowest portion of Ravenswood begins to flood.
| Date | Stage (ft) |
|---|---|
| Mar 26, 1913 | 16 |
| May 19, 1943 | 13.3 |
| Apr 23, 1964 | 12.9 |
| Jun 30, 1957 | 12.6 |
| Jan 1, 1991 | 12.5 |
| Jun 15, 1958 | 12.3 |
| Jan 16, 1937 | 12 |
| Jan 14, 2005 | 11.8 |
| Apr 20, 2013 | 11.5 |
| Jul 11, 2003 | 11.3 |
| Feb 25, 1985 | 10.9 |
| Jan 24, 1999 | 10.8 |
| Mar 7, 1963 | 10.7 |
| Jan 7, 2005 | 10.6 |
| Mar 25, 2007 | 10.6 |
| May 14, 2002 | 10.3 |
| Mar 2, 2011 | 10.2 |
| Jan 28, 1962 | 10 |
| Jan 15, 2013 | 9.95 |
| Nov 17, 1993 | 9.9 |
Data provided by the National Weather Service.