Salamonie River near Warren
Critical Stages
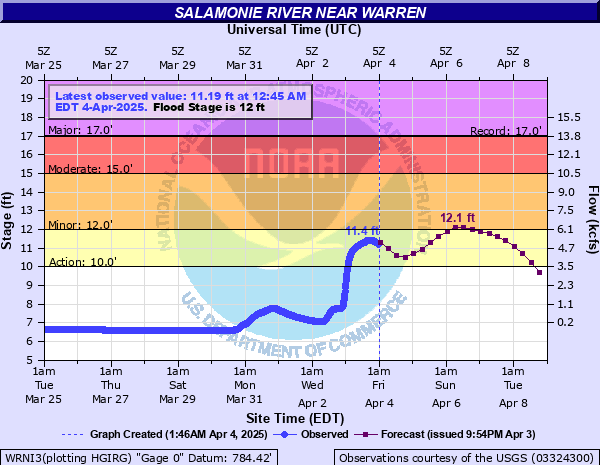
10' - Action
12' - Flood
15' - Moderate
17' - Major
Latest Observation
Updated: 12:45 AM EST 12/6/25
Status: No Flooding
Stage: 6.53 ft
Flow: 0.0405 kcfs
Forecast
Forecast not available for this location.
| Time | Stage (ft) | Flow (kcfs) |
|---|---|---|
| 12:45 AM 12/6 | 6.53 | 0.0405 |
| 12:30 AM 12/6 | 6.53 | 0.0405 |
| 12:15 AM 12/6 | 6.53 | 0.0405 |
| 12:00 AM 12/6 | 6.53 | 0.0405 |
| 11:45 PM 12/5 | 6.53 | 0.0405 |
| 11:30 PM 12/5 | 6.53 | 0.0405 |
| 11:15 PM 12/5 | 6.53 | 0.0405 |
| 11:00 PM 12/5 | 6.53 | 0.0405 |
| 10:45 PM 12/5 | 6.53 | 0.0405 |
| 10:30 PM 12/5 | 6.53 | 0.0405 |
| 10:15 PM 12/5 | 6.53 | 0.0405 |
| 10:00 PM 12/5 | 6.53 | 0.0405 |
| 9:45 PM 12/5 | 6.53 | 0.0405 |
| 9:30 PM 12/5 | 6.53 | 0.0405 |
| 9:15 PM 12/5 | 6.53 | 0.0405 |
| 9:00 PM 12/5 | 6.53 | 0.0405 |
| 8:45 PM 12/5 | 6.53 | 0.0405 |
| 8:30 PM 12/5 | 6.53 | 0.0405 |
| 8:15 PM 12/5 | 6.53 | 0.0405 |
| 8:00 PM 12/5 | 6.53 | 0.0405 |
| 7:45 PM 12/5 | 6.53 | 0.0405 |
| 7:30 PM 12/5 | 6.53 | 0.0405 |
| 7:15 PM 12/5 | 6.53 | 0.0405 |
| 7:00 PM 12/5 | 6.53 | 0.0405 |
| 6:45 PM 12/5 | 6.53 | 0.0405 |
| 6:30 PM 12/5 | 6.53 | 0.0405 |
| 6:15 PM 12/5 | 6.53 | 0.0405 |
| 6:00 PM 12/5 | 6.53 | 0.0405 |
| 5:45 PM 12/5 | 6.53 | 0.0405 |
| 5:30 PM 12/5 | 6.53 | 0.0405 |
17.2' -
Flood water begins to hit the bottom of the bridge at the gage site.
17' -
Major flooding is in progress with extensive inundation and damage. Many primary roads and bridges are closed. Evacuations from flood prone areas are necessary.
15' -
Moderate flooding can be expected. Secondary roads are blocked and the transfer of property to higher ground is necessary.
12' -
The river reaches flood stage with minor flooding of low agricultural land and roads nearest the river. Belleville Road and East Flowing Well Road northwest of Warren become impassable and isolated nearby residences.
| Date | Stage (ft) |
|---|---|
| Mar 6, 1963 | 16.94 |
| Aug 5, 1998 | 16.82 |
| Dec 30, 1990 | 16.21 |
| Mar 18, 1978 | 16.21 |
| Jun 11, 1958 | 16.13 |
| Jan 23, 1999 | 15.49 |
| Feb 24, 1985 | 15.35 |
| Jan 12, 2005 | 15.16 |
| Jan 13, 2013 | 14.99 |
| Jul 8, 2003 | 14.96 |
| Mar 13, 1982 | 14.96 |
| Feb 6, 2008 | 14.86 |
| Jul 9, 2003 | 14.74 |
| Jun 16, 2015 | 14.67 |
| May 26, 1989 | 14.6 |
| Apr 19, 2013 | 14.55 |
| Feb 17, 1976 | 14.54 |
| Jun 28, 2015 | 14.51 |
| Mar 4, 1979 | 14.51 |
| Feb 27, 1997 | 14.5 |
Data provided by the National Weather Service.