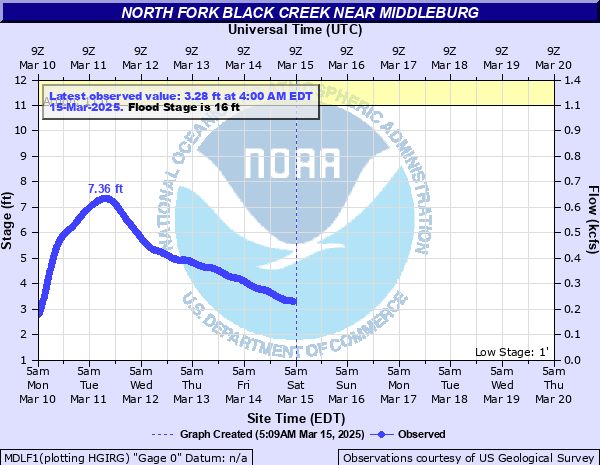
North Fork Black Creek near Middleburg
Critical Stages
11' - Action
16' - Flood
18' - Moderate
21' - Major
Latest Observation
Updated: 11:00 PM EST 12/14/25
Status: Low Threshold
Stage: 0.81 ft
Flow: 0.0214 kcfs
Forecast
Forecast not available for this location.
| Time | Stage (ft) | Flow (kcfs) |
|---|---|---|
| 12:00 AM 12/15 | 0.81 | 0.0214 |
| 11:45 PM 12/14 | 0.81 | 0.0214 |
| 11:30 PM 12/14 | 0.81 | 0.0214 |
| 11:15 PM 12/14 | 0.81 | 0.0214 |
| 11:00 PM 12/14 | 0.81 | 0.0214 |
| 10:45 PM 12/14 | 0.81 | 0.0214 |
| 10:30 PM 12/14 | 0.82 | 0.0218 |
| 10:15 PM 12/14 | 0.82 | 0.0218 |
| 10:00 PM 12/14 | 0.82 | 0.0218 |
| 9:45 PM 12/14 | 0.82 | 0.0218 |
| 9:30 PM 12/14 | 0.82 | 0.0218 |
| 9:15 PM 12/14 | 0.82 | 0.0218 |
| 9:00 PM 12/14 | 0.82 | 0.0218 |
| 8:45 PM 12/14 | 0.82 | 0.0218 |
| 8:30 PM 12/14 | 0.82 | 0.0218 |
| 8:15 PM 12/14 | 0.82 | 0.0218 |
| 8:00 PM 12/14 | 0.82 | 0.0218 |
| 7:45 PM 12/14 | 0.82 | 0.0218 |
| 7:30 PM 12/14 | 0.81 | 0.0214 |
| 7:15 PM 12/14 | 0.82 | 0.0218 |
| 7:00 PM 12/14 | 0.82 | 0.0218 |
| 6:45 PM 12/14 | 0.82 | 0.0218 |
| 6:30 PM 12/14 | 0.82 | 0.0218 |
| 6:15 PM 12/14 | 0.82 | 0.0218 |
| 6:00 PM 12/14 | 0.82 | 0.0218 |
| 5:45 PM 12/14 | 0.82 | 0.0218 |
| 5:30 PM 12/14 | 0.82 | 0.0218 |
| 5:15 PM 12/14 | 0.82 | 0.0218 |
| 5:00 PM 12/14 | 0.82 | 0.0218 |
| 4:45 PM 12/14 | 0.82 | 0.0218 |
22' -
Significant flooding of homes occurs.
19' -
Water begins to move into homes.
16' -
Lazy Acre Road begins to flood. Lowlands flood and boat docks are affected.
| Date | Stage (ft) |
|---|---|
| Sep 11, 2017 | 27.89 |
| Jun 1, 1919 | 25.3 |
| Jun 27, 2012 | 25.26 |
| Oct 4, 1992 | 24.69 |
| May 3, 1964 | 23.91 |
| Oct 19, 1944 | 23.76 |
| Aug 30, 1968 | 23.32 |
| Oct 8, 1996 | 22.95 |
| Sep 11, 1964 | 22.61 |
| Feb 4, 1970 | 22.47 |
| Feb 17, 1998 | 22.4 |
| Sep 24, 1947 | 22.34 |
| Oct 3, 1948 | 21.57 |
| Aug 23, 2008 | 21.47 |
| Sep 8, 2004 | 21.07 |
| Oct 19, 1950 | 20.88 |
| Mar 11, 1980 | 20.87 |
| Mar 29, 1970 | 20.61 |
| Sep 7, 1950 | 20.48 |
| Mar 10, 2003 | 20.39 |
Data provided by the National Weather Service.