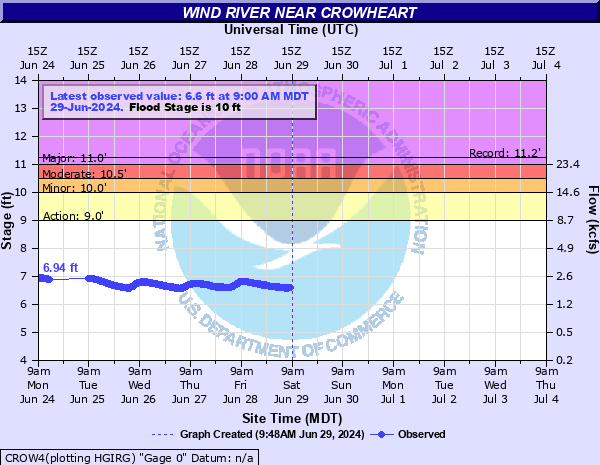
Wind River near Crowheart
Critical Stages
9' - Action
10' - Flood
10.5' - Moderate
11' - Major
Latest Observation
Updated: 11:00 PM MST 12/15/25
Status: No Flooding
Stage: 5.68 ft
Flow: -999 kcfs
Forecast
Forecast not available for this location.
| Time | Stage (ft) | Flow (kcfs) |
|---|---|---|
| 11:00 PM 12/15 | 5.68 | -999 |
| 10:45 PM 12/15 | 5.68 | -999 |
| 10:30 PM 12/15 | 5.69 | -999 |
| 10:15 PM 12/15 | 5.69 | -999 |
| 10:00 PM 12/15 | 5.69 | -999 |
| 9:45 PM 12/15 | 5.7 | -999 |
| 9:30 PM 12/15 | 5.69 | -999 |
| 9:15 PM 12/15 | 5.69 | -999 |
| 9:00 PM 12/15 | 5.66 | -999 |
| 8:45 PM 12/15 | 5.68 | -999 |
| 8:30 PM 12/15 | 5.68 | -999 |
| 8:15 PM 12/15 | 5.68 | -999 |
| 8:00 PM 12/15 | 5.67 | -999 |
| 7:45 PM 12/15 | 5.68 | -999 |
| 7:30 PM 12/15 | 5.67 | -999 |
| 7:15 PM 12/15 | 5.67 | -999 |
| 7:00 PM 12/15 | 5.67 | -999 |
| 6:45 PM 12/15 | 5.67 | -999 |
| 6:30 PM 12/15 | 5.66 | -999 |
| 6:15 PM 12/15 | 5.66 | -999 |
| 6:00 PM 12/15 | 5.66 | -999 |
| 5:45 PM 12/15 | 5.65 | -999 |
| 5:30 PM 12/15 | 5.65 | -999 |
| 5:15 PM 12/15 | 5.64 | -999 |
| 5:00 PM 12/15 | 5.64 | -999 |
| 4:45 PM 12/15 | 5.65 | -999 |
| 4:30 PM 12/15 | 5.65 | -999 |
| 4:15 PM 12/15 | 5.63 | -999 |
| 4:00 PM 12/15 | 5.64 | -999 |
| 3:45 PM 12/15 | 5.65 | -999 |
11.23' -
Record stage (6/19/1999).
11' -
Major low land and agricultural flooding upstream and downstream. High water begins to impact Highway 26 northwest of Morton to the Highway 26 Bridge. Access to gage is severely limited.
10.87' -
Record flow---14,700 cfs (7/1/2011).
10.5' -
Moderate low land flooding upstream and downstream of gage. Access to gage is becomes limited.
10' -
Flood stage. Minor low land flooding becomes more widespread. Access road to gage begins to be covered with water.
9.5' -
Very minor low land flooding begins.
9' -
Bankfull stage.
| Date | Stage (ft) |
|---|---|
| Jun 19, 1999 | 11.23 |
| Jun 13, 1991 | 11.04 |
| Jun 9, 1997 | 10.93 |
| Jul 1, 2011 | 10.87 |
| Jun 15, 1995 | 10.8 |
| Jun 19, 2018 | 10.78 |
| Jul 4, 1998 | 10.62 |
| Jun 8, 2017 | 10.39 |
| Jun 11, 1996 | 10.31 |
| May 28, 2018 | 10.24 |
| Jun 14, 2019 | 10.22 |
| Jun 24, 1971 | 10.04 |
| Jun 6, 1986 | 9.9 |
| Jun 8, 2010 | 9.87 |
| Jun 23, 2005 | 9.72 |
| Jun 11, 2015 | 9.71 |
| Jul 5, 2009 | 9.64 |
| May 22, 1993 | 9.61 |
| Jun 18, 1974 | 9.6 |
| Jun 9, 1981 | 9.59 |
Data provided by the National Weather Service.