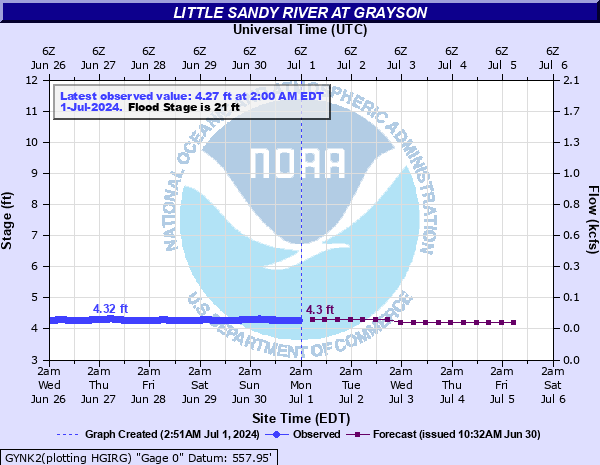
Little Sandy River at Grayson
Critical Stages
19' - Action
21' - Flood
25' - Moderate
28' - Major
Latest Observation
Updated: 11:00 PM EST 12/4/25
Status: No Flooding
Stage: 5.82 ft
Flow: 0.267 kcfs
Forecast
| Time | Stage (ft) | Flow (kcfs) |
|---|---|---|
| 1 AM 12/5 | 5.6 | 0.222 |
| 7 AM 12/5 | 5.6 | 0.222 |
| 1 PM 12/5 | 5.6 | 0.222 |
| 7 PM 12/5 | 5.6 | 0.222 |
| 1 AM 12/6 | 5.6 | 0.222 |
| 7 AM 12/6 | 5.6 | 0.222 |
| 1 PM 12/6 | 5.6 | 0.222 |
| 7 PM 12/6 | 5.5 | 0.204 |
| 1 AM 12/7 | 5.7 | 0.242 |
| 7 AM 12/7 | 5.9 | 0.285 |
| 1 PM 12/7 | 5.9 | 0.285 |
| 7 PM 12/7 | 5.8 | 0.263 |
| 1 AM 12/8 | 5.9 | 0.285 |
| 7 AM 12/8 | 6 | 0.307 |
| 1 PM 12/8 | 5.9 | 0.285 |
| 7 PM 12/8 | 5.8 | 0.263 |
| 1 AM 12/9 | 5.7 | 0.242 |
| 7 AM 12/9 | 5.6 | 0.222 |
| Time | Stage (ft) | Flow (kcfs) |
|---|---|---|
| 12:00 AM 12/5 | 5.82 | 0.267 |
| 11:45 PM 12/4 | 5.82 | 0.267 |
| 11:30 PM 12/4 | 5.82 | 0.267 |
| 11:15 PM 12/4 | 5.82 | 0.267 |
| 11:00 PM 12/4 | 5.82 | 0.267 |
| 10:45 PM 12/4 | 5.82 | 0.267 |
| 10:30 PM 12/4 | 5.82 | 0.267 |
| 10:15 PM 12/4 | 5.83 | 0.27 |
| 10:00 PM 12/4 | 5.82 | 0.267 |
| 9:45 PM 12/4 | 5.82 | 0.267 |
| 9:30 PM 12/4 | 5.82 | 0.267 |
| 9:15 PM 12/4 | 5.81 | 0.265 |
| 9:00 PM 12/4 | 5.8 | 0.263 |
| 8:45 PM 12/4 | 5.8 | 0.263 |
| 8:30 PM 12/4 | 5.8 | 0.263 |
| 8:15 PM 12/4 | 5.79 | 0.261 |
| 8:00 PM 12/4 | 5.78 | 0.259 |
| 7:45 PM 12/4 | 5.78 | 0.259 |
| 7:30 PM 12/4 | 5.77 | 0.256 |
| 7:15 PM 12/4 | 5.76 | 0.254 |
| 7:00 PM 12/4 | 5.75 | 0.252 |
| 6:45 PM 12/4 | 5.74 | 0.25 |
| 6:30 PM 12/4 | 5.73 | 0.248 |
| 6:15 PM 12/4 | 5.72 | 0.246 |
| 6:00 PM 12/4 | 5.7 | 0.242 |
| 5:45 PM 12/4 | 5.69 | 0.24 |
| 5:30 PM 12/4 | 5.67 | 0.236 |
| 5:15 PM 12/4 | 5.66 | 0.234 |
| 5:00 PM 12/4 | 5.64 | 0.23 |
| 4:45 PM 12/4 | 5.63 | 0.228 |
27.5' -
Stages of 27 and a half feet and above can expect large amounts of property damage. Evacuation of homes and businesses may be necessary.
25' -
Affects homes upstream along river and a low section of Route 60 near the river gage. Backwater along streams and creeks draining into the river.
23' -
Low spots on Route 773 and Jackson Road along the river are flooded.
22' -
Affects the buildings next to river gage. Also, water starts to flow onto Route 773 and in the Dixie Park area just past I-64 bridge. State Route 1910 floods.
21' -
Mostly farmland, a few outbuildings, and low spots on roads along river in the vicinity of Grayson start to flood.
| Date | Stage (ft) |
|---|---|
| Mar 2, 1997 | 30.57 |
| Mar 20, 2002 | 29.2 |
| Dec 9, 1978 | 28.99 |
| Mar 7, 1967 | 28.2 |
| Mar 1, 2021 | 27.95 |
| May 3, 2010 | 27.88 |
| Sep 22, 1950 | 27.53 |
| Feb 16, 1989 | 26.91 |
| Feb 1, 1939 | 26.25 |
| Mar 23, 1952 | 25.83 |
| Sep 18, 2004 | 25.71 |
| Feb 28, 1962 | 25.5 |
| May 6, 2003 | 25.43 |
| Jul 21, 2010 | 25.11 |
| Feb 14, 1966 | 25.1 |
| Feb 1, 1937 | 25 |
| Feb 17, 2003 | 24.66 |
| Apr 4, 2015 | 24.47 |
| Feb 6, 2025 | 24.42 |
| Feb 16, 2025 | 24.39 |
Data provided by the National Weather Service.