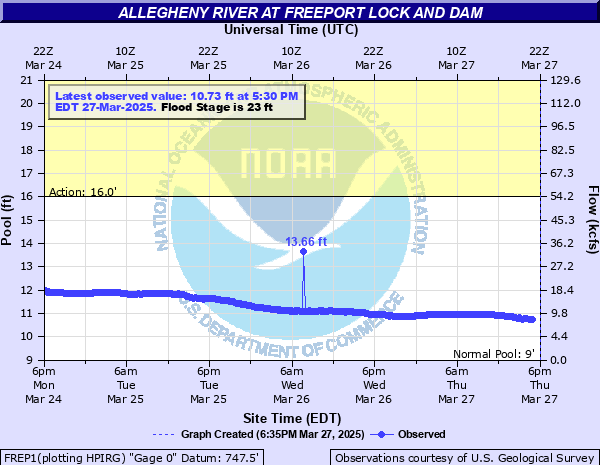
Allegheny River at Freeport Lock and Dam
Critical Stages
16' - Action
23' - Flood
24' - Moderate
26' - Major
Latest Observation
Updated: 8:30 AM EST 12/10/25
Status: No Flooding
Stage: 9.35 ft
Flow: 1.61 kcfs
Forecast
Forecast not available for this location.
| Time | Stage (ft) | Flow (kcfs) |
|---|---|---|
| 8:30 AM 12/10 | 9.35 | 1.61 |
| 8:15 AM 12/10 | 9.38 | 1.71 |
| 8:00 AM 12/10 | 9.38 | 1.71 |
| 7:45 AM 12/10 | 9.43 | 1.89 |
| 7:30 AM 12/10 | 9.4 | 1.78 |
| 7:15 AM 12/10 | 9.39 | 1.74 |
| 7:00 AM 12/10 | 9.44 | 1.93 |
| 6:45 AM 12/10 | 9.45 | 1.97 |
| 6:30 AM 12/10 | 9.44 | 1.93 |
| 6:15 AM 12/10 | 9.45 | 1.97 |
| 6:00 AM 12/10 | 9.41 | 1.82 |
| 5:45 AM 12/10 | 9.41 | 1.82 |
| 5:30 AM 12/10 | 9.45 | 1.97 |
| 5:15 AM 12/10 | 9.43 | 1.89 |
| 5:00 AM 12/10 | 9.42 | 1.85 |
| 4:45 AM 12/10 | 9.46 | 2.01 |
| 4:30 AM 12/10 | 9.44 | 1.93 |
| 4:15 AM 12/10 | 9.47 | 2.05 |
| 4:00 AM 12/10 | 9.47 | 2.05 |
| 3:45 AM 12/10 | 9.49 | 2.14 |
| 3:30 AM 12/10 | 9.48 | 2.1 |
| 3:15 AM 12/10 | 9.51 | 2.23 |
| 3:00 AM 12/10 | 9.51 | 2.23 |
| 2:45 AM 12/10 | 9.51 | 2.23 |
| 2:30 AM 12/10 | 9.53 | 2.32 |
| 2:15 AM 12/10 | 9.49 | 2.14 |
| 2:00 AM 12/10 | 9.52 | 2.27 |
| 1:45 AM 12/10 | 9.53 | 2.32 |
| 1:30 AM 12/10 | 9.52 | 2.27 |
| 1:15 AM 12/10 | 9.52 | 2.27 |
33.29' -
Water reaches the record flood level of the ST. Patricks Day Flood and crest on March 18, 1936.
25' -
Some buildings in the industrial park 1/4 mile upstream from the Lock begin to flood.
24.1' -
Water reaches the level reached during Hurricane Ivan September 18, 2004. Freeport received 6 inches of rain.
22.8' -
Backwater from Buffalo Creek surrounds the sewage disposal plant on Lower Market Street. Basements on First, Second and Lower High and Market Streets in town begin to flood.
20.2' -
Lock walls overtopped.
16' -
Navigation suspended. Lock out of service.
| Date | Stage (ft) |
|---|---|
| Mar 18, 1936 | 33.3 |
| Dec 30, 1942 | 25.7 |
| Mar 10, 1964 | 25.3 |
| Jan 20, 1996 | 25 |
| Jan 22, 1959 | 24.8 |
| Jun 23, 1972 | 24.5 |
| Sep 18, 2004 | 24.1 |
| Mar 16, 2007 | 23.6 |
| Mar 5, 1964 | 23.3 |
| Feb 14, 1966 | 22.7 |
| Feb 19, 2022 | 22.58 |
| Apr 13, 2024 | 22.52 |
| Dec 31, 1990 | 22.5 |
| Jun 21, 1989 | 22.2 |
| Jan 29, 2024 | 19.54 |
| Mar 23, 2007 | 18.5 |
Data provided by the National Weather Service.