Brush Creek at Ward Parkway - Kansas City
Critical Stages
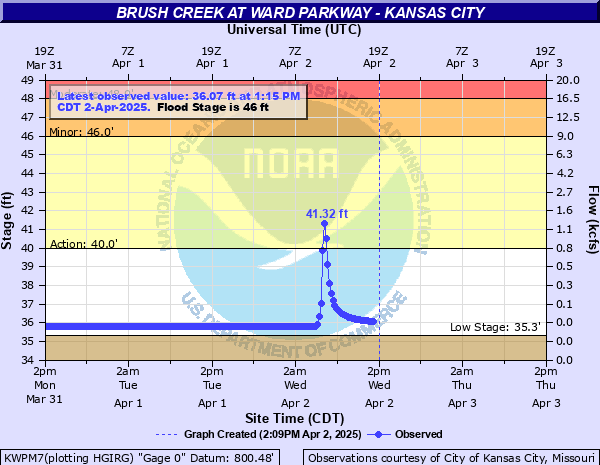
40' - Action
46' - Flood
48' - Moderate
50' - Major
Latest Observation
Updated: 4:15 PM CST 12/15/25
Status: No Flooding
Stage: 35.97 ft
Flow: 0.013 kcfs
Forecast
Forecast not available for this location.
| Time | Stage (ft) | Flow (kcfs) |
|---|---|---|
| 4:15 PM 12/15 | 35.97 | 0.013 |
| 4:00 PM 12/15 | 35.97 | 0.013 |
| 3:45 PM 12/15 | 35.97 | 0.013 |
| 3:30 PM 12/15 | 35.97 | 0.013 |
| 3:15 PM 12/15 | 35.96 | 0.0121 |
| 3:00 PM 12/15 | 35.96 | 0.0121 |
| 2:45 PM 12/15 | 35.97 | 0.013 |
| 2:30 PM 12/15 | 35.96 | 0.0121 |
| 2:15 PM 12/15 | 35.96 | 0.0121 |
| 2:00 PM 12/15 | 35.96 | 0.0121 |
| 1:45 PM 12/15 | 35.97 | 0.013 |
| 1:30 PM 12/15 | 35.97 | 0.013 |
| 1:15 PM 12/15 | 35.96 | 0.0121 |
| 1:00 PM 12/15 | 35.96 | 0.0121 |
| 12:45 PM 12/15 | 35.96 | 0.0121 |
| 12:30 PM 12/15 | 35.96 | 0.0121 |
| 12:15 PM 12/15 | 35.97 | 0.013 |
| 12:00 PM 12/15 | 35.96 | 0.0121 |
| 11:45 AM 12/15 | 35.97 | 0.013 |
| 11:30 AM 12/15 | 35.96 | 0.0121 |
| 11:15 AM 12/15 | 35.96 | 0.0121 |
| 11:00 AM 12/15 | 35.96 | 0.0121 |
| 10:45 AM 12/15 | 35.96 | 0.0121 |
| 10:30 AM 12/15 | 35.97 | 0.013 |
| 10:15 AM 12/15 | 35.96 | 0.0121 |
| 10:00 AM 12/15 | 35.96 | 0.0121 |
| 9:45 AM 12/15 | 35.96 | 0.0121 |
| 9:30 AM 12/15 | 35.96 | 0.0121 |
| 9:15 AM 12/15 | 35.96 | 0.0121 |
| 9:00 AM 12/15 | 35.96 | 0.0121 |
54.3' -
Flood waters reach the Pembroke High School gymnasium. Many other roads, bridges, homes, and businesses along the creek are flooded.
52' -
Flooding begins to threaten life and propery at Main and Brookside, Rockhill Road, and Elmwood Avenue.
50' -
Water overtops the Ward Parkway bridge. Ward Parkway and Shawnee Mission Parkway near the Ward Parkway bridge are under water. In addition, other bridges and roads upstream and downstream of the Plaza Federal Flood Control Project are flooded.
48' -
Ward Parkway and Shawnee Mission Parkway near the Ward Parkway bridge are flooded. In addition, the area along the creek between Belleview Avenue and Rockwell begins to flood.
46' -
Ward Parkway and Shawnee Mission Parkway near the Ward Parkway bridge begin to flood.
| Date | Stage (ft) |
|---|---|
| Sep 12, 1977 | 53 |
| Oct 4, 1998 | 50.14 |
| Jul 27, 2017 | 47.44 |
| Aug 26, 2016 | 47.03 |
| Aug 5, 2017 | 47.03 |
| Jul 4, 2024 | 46.21 |
| Jun 14, 2010 | 45.96 |
| May 24, 2019 | 44.99 |
| Jul 20, 2015 | 44.89 |
| Jul 29, 2020 | 44.75 |
| May 31, 2022 | 44.43 |
| Sep 3, 2021 | 44.4 |
| Sep 19, 2013 | 43.98 |
| Aug 6, 2014 | 43.95 |
| May 25, 2018 | 43.54 |
| May 6, 2012 | 43.09 |
| Aug 20, 2011 | 43.02 |
Data provided by the National Weather Service.