Indian Creek at Overland Park
Critical Stages
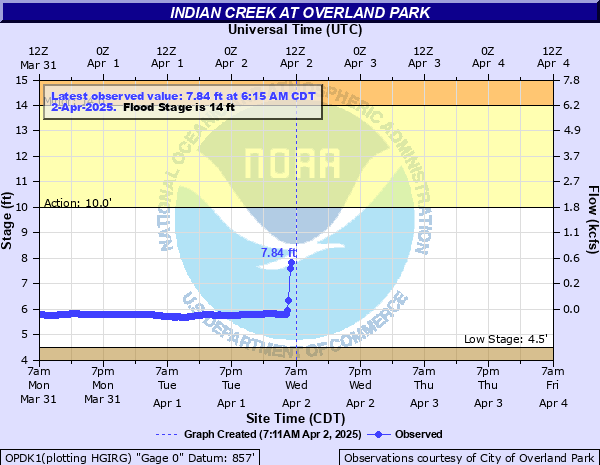
10' - Action
14' - Flood
16' - Moderate
18' - Major
Latest Observation
Updated: 4:15 PM CST 12/15/25
Status: No Flooding
Stage: 5.68 ft
Flow: 0.0179 kcfs
Forecast
Forecast not available for this location.
| Time | Stage (ft) | Flow (kcfs) |
|---|---|---|
| 4:15 PM 12/15 | 5.68 | 0.0179 |
| 4:00 PM 12/15 | 5.68 | 0.0179 |
| 3:45 PM 12/15 | 5.68 | 0.0179 |
| 3:30 PM 12/15 | 5.68 | 0.0179 |
| 3:15 PM 12/15 | 5.68 | 0.0179 |
| 3:00 PM 12/15 | 5.67 | 0.0173 |
| 2:45 PM 12/15 | 5.67 | 0.0173 |
| 2:30 PM 12/15 | 5.66 | 0.0168 |
| 2:15 PM 12/15 | 5.64 | 0.0158 |
| 2:00 PM 12/15 | 5.62 | 0.0149 |
| 1:45 PM 12/15 | 5.6 | 0.014 |
| 1:30 PM 12/15 | 5.59 | 0.0134 |
| 1:15 PM 12/15 | 5.57 | 0.0123 |
| 1:00 PM 12/15 | 5.55 | 0.0112 |
| 12:45 PM 12/15 | 5.54 | 0.0108 |
| 12:30 PM 12/15 | 5.53 | 0.0103 |
| 12:15 PM 12/15 | 5.51 | 0.0094 |
| 12:00 PM 12/15 | 5.51 | 0.0094 |
| 11:45 AM 12/15 | 5.5 | 0.009 |
| 11:30 AM 12/15 | 5.5 | 0.009 |
| 11:15 AM 12/15 | 5.5 | 0.009 |
| 11:00 AM 12/15 | 5.5 | 0.009 |
| 10:45 AM 12/15 | 5.5 | 0.009 |
| 10:30 AM 12/15 | 5.5 | 0.009 |
| 10:15 AM 12/15 | 5.51 | 0.0094 |
| 10:00 AM 12/15 | 5.51 | 0.0094 |
| 9:45 AM 12/15 | 5.51 | 0.0094 |
| 9:30 AM 12/15 | 5.52 | 0.0098 |
| 9:15 AM 12/15 | 5.52 | 0.0098 |
| 9:00 AM 12/15 | 5.53 | 0.0103 |
23.5' -
Water overtops the Marty Street bridge.
21' -
Water reaches the bottom of the Marty Street bridge.
20' -
A shopping center parking lot near the Marty Street bridge floods.
18.8' -
Many homes and businesses along Indian Creek are flooded. This includes low-lying garages on Walmer and Lamar. Buildings on Indian Creek Parkway and West 107th Street also begin to flood.
18.39' -
Flood waters reach homes and garages along West 106th Street, West 106th Terrace, West 103rd Street, Robinson, Lamar, Horton, Indian Creek Drive, Indian Creek Parkwary, Beverly, West 107th Street, and El Monte.
16.5' -
Flood waters approach homes along Conser Street.
15.1' -
Flood waters reach Antioch Road 600 feet north of Indian Creek. Water also reaches buildings near the creek along Antioch Road West 106th Circle and El Monte cul de sac.
14.3' -
Flood waters threaten basements along Lowell and Antioch road.
8' -
Low-lying land along the creek begins to flood, including a paved bike and walking path.
| Date | Stage (ft) |
|---|---|
| Aug 22, 2017 | 18.41 |
| Jul 27, 2017 | 17.98 |
| Jun 9, 1984 | 17.78 |
| Jul 1, 2024 | 16.45 |
| Oct 4, 1998 | 16.17 |
| May 15, 1990 | 16.11 |
| Jul 17, 2025 | 16.02 |
| Jul 10, 1993 | 15.82 |
| Jun 14, 2010 | 15.77 |
| Sep 13, 1977 | 15.5 |
| Jul 4, 2024 | 15.05 |
| Sep 12, 1977 | 15.04 |
| Sep 18, 1986 | 14.37 |
| Aug 6, 2017 | 14.17 |
| Jul 20, 2015 | 14.04 |
| Aug 13, 2021 | 14 |
| May 31, 2013 | 13.62 |
| May 6, 2012 | 13.22 |
| Apr 24, 2014 | 11.51 |
Data provided by the National Weather Service.