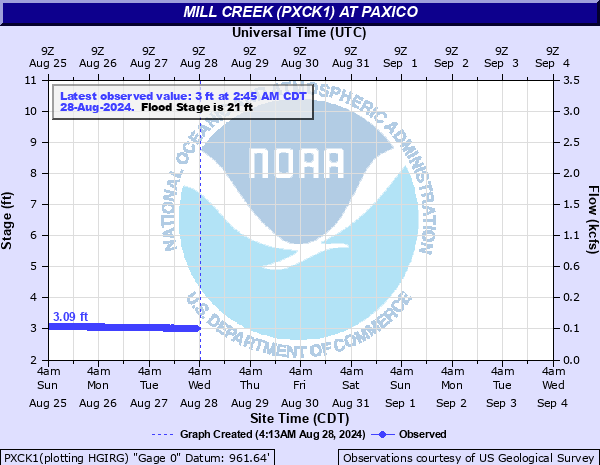
Mill Creek (PXCK1) at Paxico
Critical Stages
16' - Action
21' - Flood
31' - Moderate
33' - Major
Latest Observation
Updated: 3:45 PM CST 12/15/25
Status: No Flooding
Stage: 3.15 ft
Flow: 0.0604 kcfs
Forecast
Forecast not available for this location.
| Time | Stage (ft) | Flow (kcfs) |
|---|---|---|
| 5:00 PM 12/15 | 3.15 | 0.0604 |
| 4:45 PM 12/15 | 3.15 | 0.0604 |
| 4:30 PM 12/15 | 3.15 | 0.0604 |
| 4:15 PM 12/15 | 3.15 | 0.0604 |
| 4:00 PM 12/15 | 3.14 | 0.0586 |
| 3:45 PM 12/15 | 3.15 | 0.0604 |
| 3:30 PM 12/15 | 3.15 | 0.0604 |
| 3:15 PM 12/15 | 3.15 | 0.0604 |
| 3:00 PM 12/15 | 3.15 | 0.0604 |
| 2:45 PM 12/15 | 3.15 | 0.0604 |
| 2:30 PM 12/15 | 3.15 | 0.0604 |
| 2:15 PM 12/15 | 3.15 | 0.0604 |
| 2:00 PM 12/15 | 3.15 | 0.0604 |
| 1:45 PM 12/15 | 3.15 | 0.0604 |
| 1:30 PM 12/15 | 3.15 | 0.0604 |
| 1:15 PM 12/15 | 3.15 | 0.0604 |
| 1:00 PM 12/15 | 3.15 | 0.0604 |
| 12:45 PM 12/15 | 3.15 | 0.0604 |
| 12:30 PM 12/15 | 3.15 | 0.0604 |
| 12:15 PM 12/15 | 3.15 | 0.0604 |
| 12:00 PM 12/15 | 3.15 | 0.0604 |
| 11:45 AM 12/15 | 3.15 | 0.0604 |
| 11:30 AM 12/15 | 3.15 | 0.0604 |
| 11:15 AM 12/15 | 3.15 | 0.0604 |
| 11:00 AM 12/15 | 3.15 | 0.0604 |
| 10:45 AM 12/15 | 3.15 | 0.0604 |
| 10:30 AM 12/15 | 3.15 | 0.0604 |
| 10:15 AM 12/15 | 3.16 | 0.0622 |
| 10:00 AM 12/15 | 3.15 | 0.0604 |
| 9:45 AM 12/15 | 3.15 | 0.0604 |
34.4' -
Water overtops the railroad tracks at Newbury Avenue.
33' -
Major flooding occurs as waters top the levee on the north side of Paxico. Campsites at higher elevations begin to flood.
32.29' -
Highway 138 is overtopped by Mill Creek.
31' -
Water approaches north side of Paxico along ditch and levee.
30' -
Campsites on west side of campground begin to flood.
21' -
Low lying farm fields and campsites along the creek begin to flood.
| Date | Stage (ft) |
|---|---|
| Jul 12, 1951 | 34.7 |
| May 16, 2021 | 30.55 |
| Apr 27, 2016 | 30.41 |
| Apr 27, 2009 | 28.96 |
| May 7, 2007 | 28.02 |
| May 27, 2016 | 27.81 |
| May 26, 2019 | 27.64 |
| Jun 10, 2014 | 26.91 |
| May 8, 2019 | 26.44 |
| Jun 23, 2019 | 26.34 |
| Jul 5, 2010 | 25.37 |
| May 31, 2022 | 24.98 |
| Jul 8, 2008 | 24.79 |
| Aug 16, 2019 | 24.67 |
| May 27, 2021 | 24.17 |
| Aug 30, 2019 | 23.5 |
| May 21, 2019 | 23.09 |
| Jun 5, 2015 | 22.98 |
| May 9, 2019 | 22.83 |
| Mar 29, 2017 | 22.63 |
Data provided by the National Weather Service.