Shunganunga Creek at Topeka
Critical Stages
11' - Action
16' - Flood
17' - Moderate
22' - Major
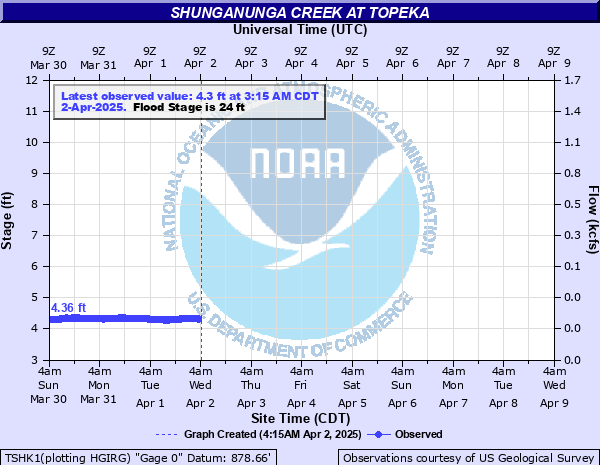
Latest Observation
Updated: 4:45 PM CST 12/15/25
Status: No Flooding
Stage: 4.26 ft
Flow: 0.0132 kcfs
Forecast
Forecast not available for this location.
| Time | Stage (ft) | Flow (kcfs) |
|---|---|---|
| 5:00 PM 12/15 | 4.26 | 0.0132 |
| 4:55 PM 12/15 | 4.26 | 0.0132 |
| 4:50 PM 12/15 | 4.25 | 0.0124 |
| 4:45 PM 12/15 | 4.26 | 0.0132 |
| 4:40 PM 12/15 | 4.26 | 0.0132 |
| 4:35 PM 12/15 | 4.26 | 0.0132 |
| 4:30 PM 12/15 | 4.25 | 0.0124 |
| 4:25 PM 12/15 | 4.25 | 0.0124 |
| 4:20 PM 12/15 | 4.25 | 0.0124 |
| 4:15 PM 12/15 | 4.25 | 0.0124 |
| 4:10 PM 12/15 | 4.26 | 0.0132 |
| 4:05 PM 12/15 | 4.26 | 0.0132 |
| 4:00 PM 12/15 | 4.26 | 0.0132 |
| 3:55 PM 12/15 | 4.26 | 0.0132 |
| 3:50 PM 12/15 | 4.26 | 0.0132 |
| 3:45 PM 12/15 | 4.26 | 0.0132 |
| 3:40 PM 12/15 | 4.26 | 0.0132 |
| 3:35 PM 12/15 | 4.26 | 0.0132 |
| 3:30 PM 12/15 | 4.26 | 0.0132 |
| 3:25 PM 12/15 | 4.25 | 0.0124 |
| 3:20 PM 12/15 | 4.25 | 0.0124 |
| 3:15 PM 12/15 | 4.26 | 0.0132 |
| 3:10 PM 12/15 | 4.26 | 0.0132 |
| 3:05 PM 12/15 | 4.26 | 0.0132 |
| 3:00 PM 12/15 | 4.26 | 0.0132 |
| 2:55 PM 12/15 | 4.26 | 0.0132 |
| 2:50 PM 12/15 | 4.26 | 0.0132 |
| 2:45 PM 12/15 | 4.25 | 0.0124 |
| 2:40 PM 12/15 | 4.26 | 0.0132 |
| 2:35 PM 12/15 | 4.25 | 0.0124 |
28.7' -
Harley Davidson parking lot near 21st and Topeka Boulevard floods.
28.43' -
21st Street bridge over the Shunganunga Creek floods.
26.92' -
Flood waters reach the bottom of the 21st Street bridge over the Shunganunga Creek.
26.2' -
The east bank of the 21st Street bridge floods.
24' -
Water flows over the west bank north of the 21st Street bridge.
22' -
Water may affect homes between Shunga Drive and 23rd Street.
21.9' -
The soccer field south of the 21st Street bridge floods.
17' -
Shunga Drive near College Avenue floods.
16' -
Walkway along the Shunganunga Creek near the 21st Street bridge floods.
| Date | Stage (ft) |
|---|---|
| May 7, 2007 | 23.28 |
| Jul 30, 2020 | 19.29 |
| Oct 1, 2005 | 16.92 |
| Aug 23, 2004 | 15.88 |
| May 13, 2010 | 15.38 |
| Jun 5, 2015 | 15.1 |
| Aug 17, 2019 | 15.1 |
| May 2, 2016 | 14.51 |
| Apr 26, 2009 | 13.81 |
| Jun 12, 2008 | 13.58 |
| Aug 20, 2005 | 13.52 |
| May 18, 2022 | 13.02 |
| Jun 10, 2014 | 12.8 |
| Jun 23, 2003 | 12.75 |
| May 27, 2013 | 12.71 |
| Aug 22, 2017 | 12.32 |
| May 31, 2023 | 12.08 |
| May 9, 2021 | 11.88 |
| May 25, 2011 | 11.39 |
| Jun 21, 2012 | 11.26 |
Data provided by the National Weather Service.