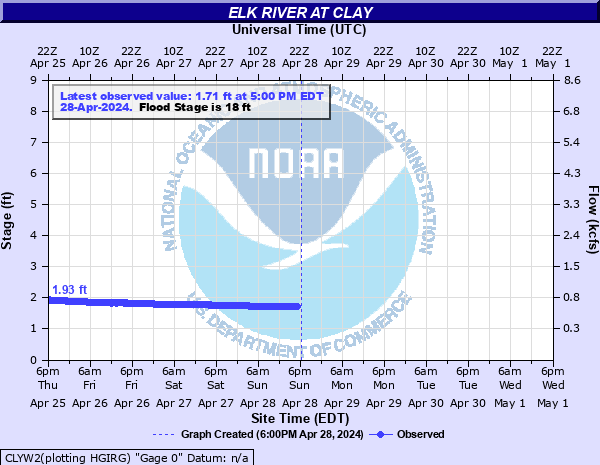
Elk River at Clay
Critical Stages
16' - Action
18' - Flood
20' - Moderate
29' - Major
Latest Observation
Updated: 9:00 PM EST 12/15/25
Status: No Flooding
Stage: 1.69 ft
Flow: 0.664 kcfs
Forecast
Forecast not available for this location.
| Time | Stage (ft) | Flow (kcfs) |
|---|---|---|
| 9:00 PM 12/15 | 1.69 | 0.664 |
| 8:45 PM 12/15 | 1.69 | 0.664 |
| 8:30 PM 12/15 | 1.69 | 0.664 |
| 8:15 PM 12/15 | 1.69 | 0.664 |
| 8:00 PM 12/15 | 1.7 | 0.67 |
| 7:45 PM 12/15 | 1.7 | 0.67 |
| 7:30 PM 12/15 | 1.7 | 0.67 |
| 7:15 PM 12/15 | 1.7 | 0.67 |
| 7:00 PM 12/15 | 1.7 | 0.67 |
| 6:45 PM 12/15 | 1.7 | 0.67 |
| 6:30 PM 12/15 | 1.7 | 0.67 |
| 6:15 PM 12/15 | 1.7 | 0.67 |
| 6:00 PM 12/15 | 1.7 | 0.67 |
| 5:45 PM 12/15 | 1.7 | 0.67 |
| 5:30 PM 12/15 | 1.7 | 0.67 |
| 5:15 PM 12/15 | 1.7 | 0.67 |
| 5:00 PM 12/15 | 1.7 | 0.67 |
| 4:45 PM 12/15 | 1.7 | 0.67 |
| 4:30 PM 12/15 | 1.71 | 0.676 |
| 4:15 PM 12/15 | 1.71 | 0.676 |
| 4:00 PM 12/15 | 1.71 | 0.676 |
| 3:45 PM 12/15 | 1.71 | 0.676 |
| 3:30 PM 12/15 | 1.72 | 0.681 |
| 3:15 PM 12/15 | 1.72 | 0.681 |
| 3:00 PM 12/15 | 1.72 | 0.681 |
| 2:45 PM 12/15 | 1.72 | 0.681 |
| 2:30 PM 12/15 | 1.72 | 0.681 |
| 2:15 PM 12/15 | 1.72 | 0.681 |
| 2:00 PM 12/15 | 1.73 | 0.687 |
| 1:45 PM 12/15 | 1.73 | 0.687 |
30' -
Most business and buildings in Clay next to the river are flooded. Major flooding occurring.
29' -
Route 16 in Clay starts to flood. Some business in town are flooded. Several sections of Elkhurst/Elk River Road and some camps near the river are flooded.
25' -
The low end of the vacant car dealership, hardware store, more homes in Pisgah section, and in the northern end of Clay are flooded. Sections of Elkhurst/Elk River Road and some camps near the river are flooded.
20' -
Homes in the Pisgah section of Clay, and a few homes on the north side of Clay are flooded between 20 and 22 feet. Sections of Elkhurst/Elk River Road are flooded.
18' -
Water floods some basements near and downstream from the Pisgah Pridge. Sections of Elkhurst/Elk River Road start to flood.
| Date | Stage (ft) |
|---|---|
| Mar 14, 1918 | 32.4 |
| Jan 1, 1861 | 31 |
| Jun 24, 2016 | 30.3 |
| Feb 5, 1932 | 26.6 |
| Jul 4, 1932 | 26.5 |
| Feb 4, 1939 | 25.4 |
| May 12, 1924 | 23.6 |
| Apr 16, 1932 | 23.5 |
| Oct 3, 1929 | 23 |
| Mar 1, 1997 | 23 |
| Mar 15, 1967 | 22.8 |
| Jan 2, 1919 | 22.7 |
| Jan 30, 1957 | 22.6 |
| Jul 31, 1996 | 21.84 |
| Nov 19, 2003 | 20.96 |
| Dec 3, 1991 | 20.83 |
| Dec 4, 1950 | 20.5 |
| Mar 12, 1917 | 20.3 |
| Feb 1, 1951 | 20.1 |
| Aug 9, 1958 | 20 |
Data provided by the National Weather Service.