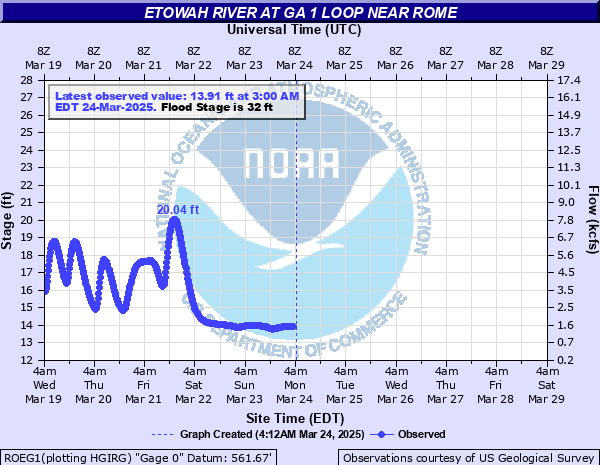
Etowah River at GA 1 Loop near Rome
Critical Stages
28' - Action
32' - Flood
36' - Moderate
40' - Major
Latest Observation
Updated: 3:00 AM EST 12/17/25
Status: No Flooding
Stage: 14.92 ft
Flow: 2.39 kcfs
Forecast
Forecast not available for this location.
| Time | Stage (ft) | Flow (kcfs) |
|---|---|---|
| 3:00 AM 12/17 | 14.92 | 2.39 |
| 2:45 AM 12/17 | 15.02 | 2.48 |
| 2:30 AM 12/17 | 15.11 | 2.57 |
| 2:15 AM 12/17 | 15.21 | 2.66 |
| 2:00 AM 12/17 | 15.31 | 2.76 |
| 1:45 AM 12/17 | 15.39 | 2.85 |
| 1:30 AM 12/17 | 15.5 | 2.96 |
| 1:15 AM 12/17 | 15.61 | 3.06 |
| 1:00 AM 12/17 | 15.71 | 3.16 |
| 12:45 AM 12/17 | 15.81 | 3.26 |
| 12:30 AM 12/17 | 15.91 | 3.36 |
| 12:15 AM 12/17 | 16.03 | 3.49 |
| 12:00 AM 12/17 | 16.12 | 3.59 |
| 11:45 PM 12/16 | 16.21 | 3.68 |
| 11:30 PM 12/16 | 16.29 | 3.76 |
| 11:15 PM 12/16 | 16.39 | 3.86 |
| 11:00 PM 12/16 | 16.48 | 3.96 |
| 10:45 PM 12/16 | 16.55 | 4.03 |
| 10:30 PM 12/16 | 16.63 | 4.12 |
| 10:15 PM 12/16 | 16.7 | 4.19 |
| 10:00 PM 12/16 | 16.75 | 4.25 |
| 9:45 PM 12/16 | 16.82 | 4.33 |
| 9:30 PM 12/16 | 16.83 | 4.34 |
| 9:15 PM 12/16 | 16.89 | 4.4 |
| 9:00 PM 12/16 | 16.92 | 4.43 |
| 8:45 PM 12/16 | 16.94 | 4.46 |
| 8:30 PM 12/16 | 16.97 | 4.49 |
| 8:15 PM 12/16 | 16.98 | 4.5 |
| 8:00 PM 12/16 | 16.99 | 4.51 |
| 7:45 PM 12/16 | 16.98 | 4.5 |
40' -
Major flooding begins. The Grizzard Park athletic fields and buildings are completely inundated.
36' -
Moderate flooding begins. The concession stand and other maintenance buildings at the Grizzard Park athletic fields begin to flood.
34' -
Minor flooding continues as the Grizzard Park athletic fields begin to flood on the right bank.
32' -
Flood Stage is reached and minor flooding begins of open fields on the right bank.
28' -
Bankfull and Action Stage is reached on the river.
| Date | Stage (ft) |
|---|---|
| Apr 9, 1938 | 37.5 |
| Nov 30, 1948 | 37.4 |
| Mar 17, 1990 | 36.77 |
| Jan 21, 1947 | 36.7 |
| Jan 9, 1946 | 36.2 |
| Feb 4, 1998 | 36.05 |
| Mar 6, 2003 | 33.44 |
| Feb 26, 1964 | 33.25 |
| Feb 4, 1982 | 32.81 |
| Mar 26, 2021 | 32.37 |
| Feb 14, 2025 | 32.17 |
| Dec 30, 1942 | 32.1 |
| Feb 22, 2019 | 32.04 |
| Jan 27, 1996 | 31.17 |
| Mar 30, 1994 | 30.7 |
| Feb 22, 1961 | 30.1 |
| Jul 12, 2005 | 29.81 |
| May 3, 1997 | 28.97 |
| Mar 20, 2001 | 28.2 |
Data provided by the National Weather Service.