Cashie River near Windsor
Critical Stages
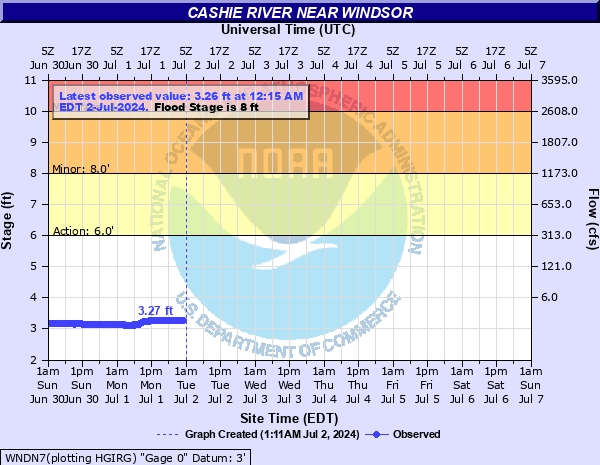
6' - Action
8' - Flood
10' - Moderate
12' - Major
Latest Observation
Updated: 7:15 AM EST 12/16/25
Status: No Flooding
Stage: 4.45 ft
Flow: 0 kcfs
Forecast
Forecast not available for this location.
| Time | Stage (ft) | Flow (kcfs) |
|---|---|---|
| 7:15 AM 12/16 | 4.45 | 0 |
| 7:00 AM 12/16 | 4.45 | 0 |
| 6:45 AM 12/16 | 4.45 | 0 |
| 6:30 AM 12/16 | 4.45 | 0 |
| 6:15 AM 12/16 | 4.45 | 0 |
| 6:00 AM 12/16 | 4.45 | 0 |
| 5:45 AM 12/16 | 4.45 | 0 |
| 5:30 AM 12/16 | 4.45 | 0 |
| 5:15 AM 12/16 | 4.45 | 0 |
| 5:00 AM 12/16 | 4.45 | 0 |
| 4:45 AM 12/16 | 4.45 | 0 |
| 4:30 AM 12/16 | 4.45 | 0 |
| 4:15 AM 12/16 | 4.45 | 0 |
| 4:00 AM 12/16 | 4.45 | 0 |
| 3:45 AM 12/16 | 4.45 | 0 |
| 3:30 AM 12/16 | 4.45 | 0 |
| 3:15 AM 12/16 | 4.45 | 0 |
| 3:00 AM 12/16 | 4.45 | 0 |
| 2:45 AM 12/16 | 4.45 | 0 |
| 2:30 AM 12/16 | 4.45 | 0 |
| 2:15 AM 12/16 | 4.45 | 0 |
| 2:00 AM 12/16 | 4.45 | 0 |
| 1:45 AM 12/16 | 4.45 | 0 |
| 1:30 AM 12/16 | 4.45 | 0 |
| 1:15 AM 12/16 | 4.45 | 0 |
| 1:00 AM 12/16 | 4.45 | 0 |
| 12:45 AM 12/16 | 4.45 | 0 |
| 12:30 AM 12/16 | 4.45 | 0 |
| 12:15 AM 12/16 | 4.45 | 0 |
| 12:00 AM 12/16 | 4.45 | 0 |
16.79' -
River stage sensor operating limit
16' -
Most buildings south of Camden Street along Sutton Street and Queen Street are inundated. Most structures south of the river along us 17 to Rhodes Ave are flooded.
15' -
US 17 south of town, US 13 north of town and Hoggards Mill Rd are inundated.
14' -
School Rd begins to flood with water over the bridge in the vicinity of the river gage. Businesses along King Street, Granville Street, and Camden Street in town are inundated with several feet of water. Homes south of the river along Maple and Elm St are inundated.
13' -
Houses north of town along Baker, Thompson and Joyner St are surrounded by water. Portions of Hoggard Mill Creek and US 13 north of town are flooded. Businesses and homes along US 17 south of town begin to flood.
12' -
Business along King St are flooded between Elmo St and Granville St. The Highway 17 bridge south of town begins to flood and Sutton Dr is flooding.
10' -
Livermon Park and Zoo are inundated. Portions of King St, Granville St, Queen St, Rascoe St and Camden St are flooded.
8' -
Portions of N. York St, Davis Ball Park and the Cashie Wetlands Walk begin to flood.
| Date | Stage (ft) |
|---|---|
| Sep 16, 1999 | 18.52 |
| Oct 9, 2016 | 16.63 |
| Oct 1, 2010 | 15.69 |
| Sep 22, 2016 | 14.78 |
| Oct 19, 1999 | 12.52 |
| Aug 16, 2004 | 12.24 |
| Aug 28, 2011 | 12.14 |
| Jun 17, 2001 | 12.07 |
| Sep 20, 2003 | 11.78 |
| Nov 13, 2020 | 11.51 |
| Aug 18, 1992 | 11.51 |
| Feb 6, 1998 | 11.49 |
| Jun 16, 2006 | 11.41 |
| Feb 8, 2020 | 10.74 |
| Sep 3, 2006 | 10.54 |
| Mar 4, 1994 | 10.07 |
| Feb 6, 2016 | 9.8 |
| Jun 12, 2021 | 9.66 |
| Jun 5, 2021 | 9.62 |
| May 3, 1989 | 9.57 |
Data provided by the National Weather Service.