« Back to Plainfield Pond Rivers
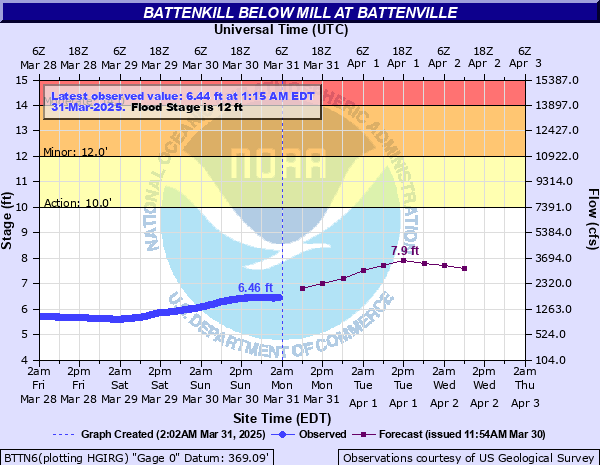
Battenkill below Mill at Battenville
Critical Stages
10' - Action
12' - Flood
14' - Moderate
16' - Major
Latest Observation
Updated: 5:15 PM EST 12/15/25
Status: No Flooding
Stage: 4.68 ft
Flow: 0.354 kcfs
Forecast
| Time | Stage (ft) | Flow (kcfs) |
|---|---|---|
| 7 PM 12/15 | 4.6 | 0.318 |
| 1 AM 12/16 | 4.6 | 0.318 |
| 7 AM 12/16 | 4.6 | 0.318 |
| 1 PM 12/16 | 4.6 | 0.318 |
| 7 PM 12/16 | 4.6 | 0.318 |
| 1 AM 12/17 | 4.6 | 0.318 |
| 7 AM 12/17 | 4.6 | 0.318 |
| 1 PM 12/17 | 4.6 | 0.318 |
| 7 PM 12/17 | 4.6 | 0.318 |
| 1 AM 12/18 | 4.6 | 0.318 |
| 7 AM 12/18 | 4.6 | 0.318 |
| Time | Stage (ft) | Flow (kcfs) |
|---|---|---|
| 6:15 PM 12/15 | 4.66 | 0.345 |
| 6:00 PM 12/15 | 4.66 | 0.345 |
| 5:45 PM 12/15 | 4.67 | 0.35 |
| 5:30 PM 12/15 | 4.67 | 0.35 |
| 5:15 PM 12/15 | 4.68 | 0.354 |
| 5:00 PM 12/15 | 4.69 | 0.359 |
| 4:45 PM 12/15 | 4.7 | 0.364 |
| 4:30 PM 12/15 | 4.72 | 0.374 |
| 4:15 PM 12/15 | 4.73 | 0.378 |
| 4:00 PM 12/15 | 4.74 | 0.383 |
| 3:45 PM 12/15 | 4.75 | 0.388 |
| 3:30 PM 12/15 | 4.76 | 0.393 |
| 3:15 PM 12/15 | 4.76 | 0.393 |
| 3:00 PM 12/15 | 4.76 | 0.393 |
| 2:45 PM 12/15 | 4.76 | 0.393 |
| 2:30 PM 12/15 | 4.76 | 0.393 |
| 2:15 PM 12/15 | 4.76 | 0.393 |
| 2:00 PM 12/15 | 4.75 | 0.388 |
| 1:45 PM 12/15 | 4.74 | 0.383 |
| 1:30 PM 12/15 | 4.74 | 0.383 |
| 1:15 PM 12/15 | 4.73 | 0.378 |
| 1:00 PM 12/15 | 4.72 | 0.374 |
| 12:45 PM 12/15 | 4.71 | 0.369 |
| 12:30 PM 12/15 | 4.71 | 0.369 |
| 12:15 PM 12/15 | 4.71 | 0.369 |
| 12:00 PM 12/15 | 4.71 | 0.369 |
| 11:45 AM 12/15 | 4.71 | 0.369 |
| 11:30 AM 12/15 | 4.7 | 0.364 |
| 11:15 AM 12/15 | 4.7 | 0.364 |
| 11:00 AM 12/15 | 4.7 | 0.364 |
17' -
Mills and homes in Greenwich are inundated with heavy losses.
16' -
Major flood stage.
15' -
Water reaches Route 29 near Middle Falls, 3 homes in Center Falls, Greenwich and several homes between Battenville and East Greenwich.
14' -
Moderate flood stage.
13' -
The river floods Route 29 near Greenwich.
12' -
Flood stage.
11' -
Water overflows onto nearby farm lands and damages crops.
10' -
The river is near bankfull.
| Date | Stage (ft) |
|---|---|
| Nov 4, 1927 | 17.7 |
| Dec 31, 1948 | 15.88 |
| Sep 22, 1938 | 14.82 |
| Mar 14, 1977 | 14.8 |
| Aug 29, 2011 | 14.27 |
| Mar 18, 1936 | 14 |
| Mar 12, 1936 | 12.59 |
| Jan 28, 1976 | 12.2 |
| Jan 20, 1996 | 12.19 |
| Dec 18, 2000 | 12.12 |
| Jan 10, 1998 | 11.95 |
| May 30, 1984 | 11.7 |
| Apr 4, 1960 | 11.6 |
| Jan 20, 1999 | 11.3 |
| Feb 21, 1989 | 11.06 |
| Aug 9, 1976 | 10.8 |
| Mar 28, 1913 | 10.5 |
| Jan 25, 1999 | 10.27 |
| Mar 9, 2008 | 10.02 |
| Dec 14, 1983 | 9.7 |
Data provided by the National Weather Service.